Bank of America 2012 Annual Report Download - page 40
Download and view the complete annual report
Please find page 40 of the 2012 Bank of America annual report below. You can navigate through the pages in the report by either clicking on the pages listed below, or by using the keyword search tool below to find specific information within the annual report.-
 1
1 -
2
-
3
-
4
-
5
-
6
-
7
-
8
-
9
-
10
-
11
-
12
-
13
-
14
-
15
-
16
-
17
-
18
-
19
-
20
-
21
-
22
-
23
-
24
-
25
-
26
-
27
-
28
-
29
-
 30
30 -
 31
31 -
 32
32 -
 33
33 -
 34
34 -
 35
35 -
 36
36 -
 37
37 -
 38
38 -
 39
39 -
 40
40 -
 41
41 -
 42
42 -
 43
43 -
 44
44 -
 45
45 -
 46
46 -
 47
47 -
 48
48 -
 49
49 -
 50
50 -
51
-
52
-
53
-
54
-
55
-
56
-
57
-
58
-
59
-
60
-
61
-
62
-
63
-
64
-
65
-
66
-
67
-
68
-
69
-
70
-
71
-
72
-
73
-
74
-
75
-
76
-
77
-
78
-
79
-
80
-
81
-
82
-
83
-
84
-
85
-
86
-
87
-
88
-
89
-
90
-
91
-
92
-
93
-
94
-
95
-
96
-
97
-
98
-
99
-
100
-
101
-
102
-
103
-
104
-
105
-
106
-
107
-
108
-
109
-
110
-
111
-
112
-
113
-
114
-
115
-
116
-
117
-
118
-
119
-
120
-
121
-
122
-
123
-
124
-
125
-
126
-
127
-
128
-
129
-
130
-
131
-
132
-
133
-
134
-
135
-
136
-
137
-
138
-
139
-
140
-
141
-
142
-
143
-
144
-
145
-
146
-
147
-
148
-
149
-
150
-
151
-
152
-
153
-
154
-
155
-
156
-
157
-
158
-
159
-
160
-
161
-
162
-
163
-
164
-
165
-
166
-
167
-
168
-
169
-
170
-
171
-
172
-
173
-
174
-
175
-
176
-
177
-
178
-
179
-
180
-
181
-
182
-
183
-
184
-
185
-
186
-
187
-
188
-
189
-
190
-
191
-
192
-
193
-
194
-
195
-
196
-
197
-
198
-
199
-
200
-
201
-
202
-
203
-
204
-
205
-
206
-
207
-
208
-
209
-
210
-
211
-
212
-
213
-
214
-
215
-
216
-
217
-
218
-
219
-
220
-
221
-
222
-
223
-
224
-
225
-
226
-
227
-
228
-
229
-
230
-
231
-
232
-
233
-
234
-
235
-
236
-
237
-
238
-
239
-
240
-
241
-
242
-
243
-
244
-
245
-
246
-
247
-
248
-
249
-
250
-
251
-
252
-
253
-
254
-
255
-
256
-
257
-
258
-
259
-
260
-
261
-
262
-
263
-
264
-
265
-
266
-
267
-
268
-
269
-
270
-
271
-
272
-
273
-
274
-
275
-
276
-
277
-
278
-
279
-
280
-
281
-
282
-
283
-
284
 |
 |
38 Bank of America 2012
both the non-PCI and PCI home equity loan portfolios. Noninterest
expense decreased $4.5 billion primarily due to a decline in
litigation expense, the absence of a goodwill impairment charge
in 2012 compared to $2.6 billion in 2011, a decline in production
and insurance expenses in Home Loans and a reduction in Legacy
Assets & Servicing expenses.
Average economic capital decreased eight percent primarily
due to a reduction in operational risk driven by the sale of Balboa
and a reduction in credit risk. For more information regarding
economic capital, see Supplemental Financial Data on page 31.
Home Loans
Home Loans products are available to our customers through our
retail network of approximately 5,500 banking centers, mortgage
loan officers in 375 locations and a sales force offering our
customers direct telephone and online access to our products.
These products were also offered through our correspondent
lending channel which we exited in the second half of 2011 and
the reverse mortgage origination business which we exited in the
first half of 2011. These strategic changes were made to allow
greater focus on our direct-to-consumer channels, deepen
relationships with existing customers and use mortgage products
to acquire new relationships.
Home Loans also included the Balboa insurance operations
through June 30, 2011, when the ongoing insurance business was
transferred to CBB following the sale of Balboa.
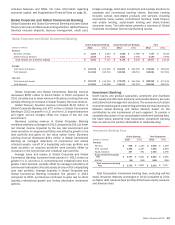
Net income for Home Loans increased $223 million to $892
million primarily driven by a decrease in noninterest expense and
lower provision for credit losses, partially offset by a decline in
revenue.
The $1.2 billion decline in revenue was the result of a decrease
of $744 million in insurance income as a result of the Balboa sale
in 2011 and a $467 million decline in net interest income primarily
driven by lower LHFS balances due to our exit from the
correspondent lending channel and lower home equity balances.
In addition, a net gain of $752 million on the sale of Balboa in
2011 contributed to the decline in revenue. These declines were
partially offset by an increase of $972 million in mortgage banking
income as higher retail margins more than offset lower
originations.
The $161 million decline in the provision for credit losses was
driven by improved portfolio trends and increasing home prices.
The $1.4 billion decline in noninterest expense was primarily due
to lower insurance expense as a result of the sale of Balboa, lower
production expense driven by lower retail originations and our exit
from the correspondent lending channel.
Legacy Assets & Servicing
Legacy Assets & Servicing is responsible for all of our servicing
activities related to the residential, home equity and discontinued
real estate loan portfolios, including owned loans and loans
serviced for others (collectively, the mortgage serviced portfolio).
A portion of this portfolio has been designated as the Legacy
Serviced Portfolio, which represents 39 percent, 42 percent and
49 percent of the total mortgage serviced portfolio, as measured
by unpaid principal balance, at December 31, 2012, 2011 and
2010, respectively.
Legacy Assets & Servicing results reflect the net cost of legacy
exposures that are included in the results of CRES, including
representations and warranties provision, litigation costs, financial
results of the CRES home equity portfolio selected as part of the
Legacy Owned Portfolio, the financial results of the servicing
operations and the results of MSR activities, including net hedge
results. The financial results of the servicing operations reflect
certain revenues and expenses on loans serviced for others,
including owned loans serviced for Home Loans, GWIM and All
Other.
Servicing activities include collecting cash for principal,
interest and escrow payments from borrowers, and disbursing
customer draws for lines of credit and accounting for and remitting
principal and interest payments to investors and escrow payments
to third parties along with responding to customer inquiries. Our
home retention efforts, including single point of contact resources,
are also part of our servicing activities, along with supervising
foreclosures and property dispositions. In an effort to help our
customers avoid foreclosure, Legacy Assets & Servicing evaluates
various workout options prior to foreclosure sales which, combined
with our temporary halt of foreclosures announced in October
2010, has resulted in elongated default timelines. Although we
have resumed foreclosure proceedings in all states, there
continues to be significant inventory levels in judicial states. For
additional information on our servicing activities, including the
impact of foreclosure delays, see Off-Balance Sheet Arrangements
and Contractual Obligations – Other Mortgage-related Matters on
page 57.
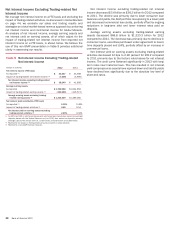
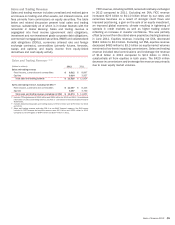
The net loss for Legacy Assets & Servicing decreased $12.7
billion to $7.4 billion driven by an improvement in mortgage
banking income, a decrease in noninterest expense and a
decrease in the provision for credit losses. The $12.8 billion
increase in mortgage banking income was primarily due to a
decrease of $11.7 billion in representations and warranties
provision. The 2012 representations and warranties provision of
$3.9 billion included $2.5 billion in provision related to the FNMA
Settlement and $500 million for obligations to FNMA related to
mortgage insurance rescissions. The 2011 representations and
warranties provision of $15.6 billion included $8.6 billion in
provision and other costs related to the settlement with Bank of
New York Mellon (BNY Mellon Settlement) to resolve nearly all of
the legacy Countrywide-issued first-lien non-GSE repurchase
exposures, and $7.0 billion in provision related to other non-GSE,
and to a lesser extent, GSE exposures. The provision for credit
losses decreased $2.9 billion due to improved portfolio trends
and increasing home prices in both the non-PCI and PCI home
equity loan portfolios.
Noninterest expense decreased $3.1 billion primarily due to a
$3.0 billion decline in litigation expense, the absence of a goodwill
impairment charge in 2012 compared to $2.6 billion in 2011, and
$1.0 billion lower mortgage-related assessments, waivers and
similar costs related to foreclosure delays. These declines were
partially offset by an increase of $2.4 billion in default-related
servicing expenses and a $1.1 billion provision for the 2013 IFR
Acceleration Agreement. For more information on the 2013 IFR
Acceleration Agreement, see Off-Balance Sheet Arrangements and
Contractual Obligations – Servicing Matters and Foreclosure
Processes on page 57. The increase in default-related servicing
expenses was due to resources needed to implement new
servicing standards mandated for the industry, including as part
of the National Mortgage Settlement, other operational changes
and costs due to delayed foreclosures.