Bank of America 2012 Annual Report Download - page 95
Download and view the complete annual report
Please find page 95 of the 2012 Bank of America annual report below. You can navigate through the pages in the report by either clicking on the pages listed below, or by using the keyword search tool below to find specific information within the annual report.-
 1
1 -
2
-
3
-
4
-
5
-
6
-
7
-
8
-
9
-
10
-
11
-
12
-
13
-
14
-
15
-
16
-
17
-
18
-
19
-
20
-
21
-
22
-
23
-
24
-
25
-
26
-
27
-
28
-
29
-
30
-
31
-
32
-
33
-
34
-
35
-
36
-
37
-
38
-
39
-
40
-
41
-
42
-
43
-
44
-
45
-
46
-
47
-
48
-
49
-
50
-
51
-
52
-
53
-
54
-
55
-
56
-
57
-
58
-
59
-
60
-
61
-
62
-
63
-
64
-
65
-
66
-
67
-
68
-
69
-
70
-
71
-
72
-
73
-
74
-
75
-
76
-
77
-
78
-
79
-
80
-
81
-
82
-
83
-
84
-
 85
85 -
 86
86 -
 87
87 -
 88
88 -
 89
89 -
 90
90 -
 91
91 -
 92
92 -
 93
93 -
 94
94 -
 95
95 -
 96
96 -
 97
97 -
 98
98 -
 99
99 -
 100
100 -
 101
101 -
 102
102 -
 103
103 -
 104
104 -
 105
105 -
106
-
107
-
108
-
109
-
110
-
111
-
112
-
113
-
114
-
115
-
116
-
117
-
118
-
119
-
120
-
121
-
122
-
123
-
124
-
125
-
126
-
127
-
128
-
129
-
130
-
131
-
132
-
133
-
134
-
135
-
136
-
137
-
138
-
139
-
140
-
141
-
142
-
143
-
144
-
145
-
146
-
147
-
148
-
149
-
150
-
151
-
152
-
153
-
154
-
155
-
156
-
157
-
158
-
159
-
160
-
161
-
162
-
163
-
164
-
165
-
166
-
167
-
168
-
169
-
170
-
171
-
172
-
173
-
174
-
175
-
176
-
177
-
178
-
179
-
180
-
181
-
182
-
183
-
184
-
185
-
186
-
187
-
188
-
189
-
190
-
191
-
192
-
193
-
194
-
195
-
196
-
197
-
198
-
199
-
200
-
201
-
202
-
203
-
204
-
205
-
206
-
207
-
208
-
209
-
210
-
211
-
212
-
213
-
214
-
215
-
216
-
217
-
218
-
219
-
220
-
221
-
222
-
223
-
224
-
225
-
226
-
227
-
228
-
229
-
230
-
231
-
232
-
233
-
234
-
235
-
236
-
237
-
238
-
239
-
240
-
241
-
242
-
243
-
244
-
245
-
246
-
247
-
248
-
249
-
250
-
251
-
252
-
253
-
254
-
255
-
256
-
257
-
258
-
259
-
260
-
261
-
262
-
263
-
264
-
265
-
266
-
267
-
268
-
269
-
270
-
271
-
272
-
273
-
274
-
275
-
276
-
277
-
278
-
279
-
280
-
281
-
282
-
283
-
284
 |
 |

Bank of America 2012 93
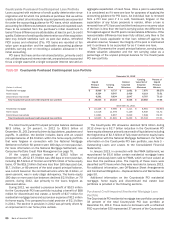
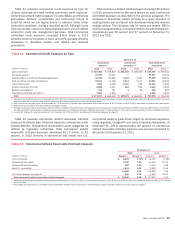
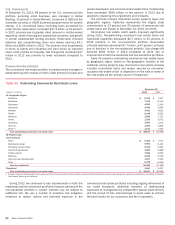
Table 41 presents commercial credit exposure by type for
utilized, unfunded and total binding committed credit exposure.
Commercial utilized credit exposure includes SBLCs and financial
guarantees, bankers’ acceptances and commercial letters of
credit for which we are legally bound to advance funds under
prescribed conditions, during a specified period. Although funds
have not yet been advanced, these exposure types are considered
utilized for credit risk management purposes. Total commercial
committed credit exposure increased $16.5 billion in 2012
primarily driven by increases in loans and LHFS, partially offset by
decreases in derivative assets, and SBLCs and financial
guarantees.
Total commercial utilized credit exposure increased $5.2 billion
in 2012 primarily driven by the same factors as total commercial
committed exposure as described in the previous paragraph. The
decrease in derivatives relates primarily to a lower valuation of
existing trades due to interest rate decreases along with reduced
trading volume. The utilization rate for loans and leases, SBLCs
and financial guarantees, commercial letters of credit and bankers’
acceptances was 58 percent and 57 percent at December 31,
2012 and 2011.
Table 41 Commercial Credit Exposure by Type
December 31
Commercial
Utilized (1)
Commercial
Unfunded (2, 3)
Total Commercial
Committed
(Dollars in millions) 2012 2011 2012 2011 2012 2011
Loans and leases $ 354,380 $316,816 $ 281,915 $276,195 $ 636,295 $ 593,011
Derivative assets (4) 53,497 73,023 ——53,497 73,023
Standby letters of credit and financial guarantees 41,036 55,384 2,119 1,592 43,155 56,976
Debt securities and other investments 10,937 11,108 6,914 5,147 17,851 16,255
Loans held-for-sale 7,928 5,006 3,763 229 11,691 5,235
Commercial letters of credit 2,065 2,411 564 832 2,629 3,243
Bankers’ acceptances 185 797 328 188 825
Foreclosed properties and other (5) 1,699 1,964 ——1,699 1,964
Total $ 471,727 $466,509 $ 295,278 $284,023 $ 767,005 $ 750,532
(1) Total commercial utilized exposure at December 31, 2012 and 2011 includes loans and issued letters of credit and is comprised of loans outstanding of $8.0 billion and $6.6 billion and commercial
letters of credit with a notional value of $672 million and $1.3 billion accounted for under the fair value option.
(2) Total commercial unfunded exposure at December 31, 2012 and 2011 includes loan commitments with a notional value of $17.6 billion and $24.4 billion accounted for under the fair value option.
(3) Excludes unused business card lines which are not legally binding.
(4) Derivative assets are carried at fair value, reflect the effects of legally enforceable master netting agreements and have been reduced by cash collateral of $58.1 billion and $58.9 billion at December
31, 2012 and 2011. Not reflected in utilized and committed exposure is additional derivative collateral held of $18.7 billion and $16.1 billion which consists primarily of other marketable securities.
(5) Includes $1.3 billion of monoline exposure at both December 31, 2012 and 2011, as discussed in Monoline Exposure on page 99.
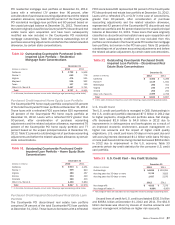
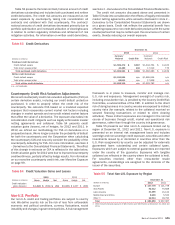
Table 42 presents commercial utilized reservable criticized
exposure by product type. Criticized exposure corresponds to the
Special Mention, Substandard and Doubtful asset categories as
defined by regulatory authorities. Total commercial utilized
reservable criticized exposure decreased $11.3 billion, or 42
percent, in 2012 primarily in commercial real estate and U.S.
commercial property types driven largely by continued paydowns,
rating upgrades, charge-offs and sales outpacing downgrades. At
December 31, 2012, approximately 82 percent of commercial
utilized reservable criticized exposure was secured compared to
85 percent at December 31, 2011.
Table 42 Commercial Utilized Reservable Criticized Exposure
December 31
2012 2011
(Dollars in millions) Amount (1) Percent (2) Amount (1) Percent (2)
U.S. commercial $ 8,631 3.72%$ 11,731 5.16%
Commercial real estate 3,782 9.24 11,525 27.13
Commercial lease financing 969 4.06 1,140 5.18
Non-U.S. commercial 1,614 2.02 1,524 2.44
14,996 3.98 25,920 7.32
U.S. small business commercial 940 7.45 1,327 10.01
Total commercial utilized reservable criticized exposure $ 15,936 4.10 $ 27,247 7.41
(1) Total commercial utilized reservable criticized exposure at December 31, 2012 and 2011 includes loans and leases of $14.6 billion and $25.3 billion and commercial letters of credit of $1.3 billion
and $1.9 billion.
(2) Percentages are calculated as commercial utilized reservable criticized exposure divided by total commercial utilized reservable exposure for each exposure category.