Bank of America 2012 Annual Report Download - page 118
Download and view the complete annual report
Please find page 118 of the 2012 Bank of America annual report below. You can navigate through the pages in the report by either clicking on the pages listed below, or by using the keyword search tool below to find specific information within the annual report.-
 1
1 -
2
-
3
-
4
-
5
-
6
-
7
-
8
-
9
-
10
-
11
-
12
-
13
-
14
-
15
-
16
-
17
-
18
-
19
-
20
-
21
-
22
-
23
-
24
-
25
-
26
-
27
-
28
-
29
-
30
-
31
-
32
-
33
-
34
-
35
-
36
-
37
-
38
-
39
-
40
-
41
-
42
-
43
-
44
-
45
-
46
-
47
-
48
-
49
-
50
-
51
-
52
-
53
-
54
-
55
-
56
-
57
-
58
-
59
-
60
-
61
-
62
-
63
-
64
-
65
-
66
-
67
-
68
-
69
-
70
-
71
-
72
-
73
-
74
-
75
-
76
-
77
-
78
-
79
-
80
-
81
-
82
-
83
-
84
-
85
-
86
-
87
-
88
-
89
-
90
-
91
-
92
-
93
-
94
-
95
-
96
-
97
-
98
-
99
-
100
-
101
-
102
-
103
-
104
-
105
-
106
-
107
-
 108
108 -
 109
109 -
 110
110 -
 111
111 -
 112
112 -
 113
113 -
 114
114 -
 115
115 -
 116
116 -
 117
117 -
 118
118 -
 119
119 -
 120
120 -
 121
121 -
 122
122 -
 123
123 -
 124
124 -
 125
125 -
 126
126 -
 127
127 -
 128
128 -
129
-
130
-
131
-
132
-
133
-
134
-
135
-
136
-
137
-
138
-
139
-
140
-
141
-
142
-
143
-
144
-
145
-
146
-
147
-
148
-
149
-
150
-
151
-
152
-
153
-
154
-
155
-
156
-
157
-
158
-
159
-
160
-
161
-
162
-
163
-
164
-
165
-
166
-
167
-
168
-
169
-
170
-
171
-
172
-
173
-
174
-
175
-
176
-
177
-
178
-
179
-
180
-
181
-
182
-
183
-
184
-
185
-
186
-
187
-
188
-
189
-
190
-
191
-
192
-
193
-
194
-
195
-
196
-
197
-
198
-
199
-
200
-
201
-
202
-
203
-
204
-
205
-
206
-
207
-
208
-
209
-
210
-
211
-
212
-
213
-
214
-
215
-
216
-
217
-
218
-
219
-
220
-
221
-
222
-
223
-
224
-
225
-
226
-
227
-
228
-
229
-
230
-
231
-
232
-
233
-
234
-
235
-
236
-
237
-
238
-
239
-
240
-
241
-
242
-
243
-
244
-
245
-
246
-
247
-
248
-
249
-
250
-
251
-
252
-
253
-
254
-
255
-
256
-
257
-
258
-
259
-
260
-
261
-
262
-
263
-
264
-
265
-
266
-
267
-
268
-
269
-
270
-
271
-
272
-
273
-
274
-
275
-
276
-
277
-
278
-
279
-
280
-
281
-
282
-
283
-
284
 |
 |
116 Bank of America 2012
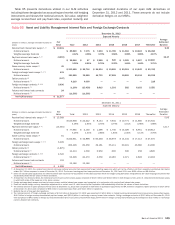
We use interest rate derivative instruments to hedge the
variability in the cash flows of our assets and liabilities and other
forecasted transactions (collectively referred to as cash flow
hedges). The net losses on both open and terminated cash flow
hedge derivative instruments recorded in accumulated OCI, net-
of-tax, were $2.9 billion and $3.8 billion at December 31, 2012
and 2011. These net losses are expected to be reclassified into
earnings in the same period as the hedged cash flows affect
earnings and will decrease income or increase expense on the
respective hedged cash flows. Assuming no change in open cash
flow derivative hedge positions and no changes in prices or interest
rates beyond what is implied in forward yield curves at
December 31, 2012, the pre-tax net losses are expected to be
reclassified into earnings as follows: $1.0 billion, or 22 percent
within the next year, 58 percent in years two through five, and 13
percent in years six through ten, with the remaining seven percent
thereafter. For more information on derivatives designated as cash
flow hedges, see Note 3 – Derivatives to the Consolidated Financial
Statements.
We hedge our net investment in non-U.S. operations determined
to have functional currencies other than the U.S. dollar using
forward foreign exchange contracts that typically settle in less than
180 days, cross-currency basis swaps, foreign exchange options
and foreign currency-denominated debt. We recorded after-tax
gains on derivatives and foreign currency-denominated debt in
accumulated OCI associated with net investment hedges which
were offset by losses on our net investments in consolidated non-
U.S. entities at December 31, 2012.
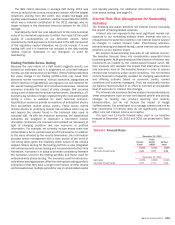
Mortgage Banking Risk Management
We originate, fund and service mortgage loans, which subject us
to credit, liquidity and interest rate risks, among others. We
determine whether loans will be HFI or held-for-sale at the time of
commitment and manage credit and liquidity risks by selling or
securitizing a portion of the loans we originate.
Interest rate risk and market risk can be substantial in the
mortgage business. Fluctuations in interest rates drive consumer
demand for new mortgages and the level of refinancing activity,
which in turn, affects total origination and service fee income.
Typically, a decline in mortgage interest rates will lead to an
increase in mortgage originations and fees and a decrease in the
value of the MSRs driven by higher prepayment expectations.
Hedging the various sources of interest rate risk in mortgage
banking is a complex process that requires complex modeling and
ongoing monitoring. IRLCs and the related residential first
mortgage LHFS are subject to interest rate risk between the date
of the IRLC and the date the loans are sold to the secondary
market. To hedge interest rate risk, we utilize forward loan sale
commitments and other derivative instruments including
purchased options. These instruments are used to hedge certain
market risks of IRLCs and residential first mortgage LHFS. At
December 31, 2012 and 2011, the notional amount of derivatives
economically hedging the IRLCs and residential first mortgage
LHFS was $31.1 billion and $14.7 billion.
MSRs are nonfinancial assets created when the underlying
mortgage loan is sold to investors and we retain the right to service
the loan. We use certain derivatives such as interest rate options,
interest rate swaps, forward settlement contracts and Eurodollar
futures, as well as MBS and U.S. Treasuries to hedge certain
market risks of MSRs. The notional amounts of the derivative
contracts and principal value of other securities hedging the MSRs
were $2.5 trillion and $31.3 billion at December 31, 2012
compared to $2.6 trillion and $46.3 billion at December 31, 2011.
In 2012, we recorded gains in mortgage banking income of $2.3
billion related to the change in fair value of the derivative contracts
and other securities used to hedge the market risks of the MSRs
compared to $6.3 billion for 2011. For additional information on
MSRs, see Note 24 – Mortgage Servicing Rights to the Consolidated
Financial Statements and for more information on mortgage
banking income, see CRES on page 37.
Compliance Risk Management
Compliance risk is the risk of legal or regulatory sanctions, material
financial loss or damage to the reputation of the Corporation
arising from the failure to comply with requirements applicable to
banking and financial services laws, rules and regulations.
Compliance is at the core of the Corporation’s culture and is a key
component of risk management discipline.
The Global Compliance organization is responsible for driving
a culture of compliance; establishing compliance program
requirements and related policies; executing the monitoring and
testing of business controls; performing risk assessments on the
businesses’ adherence to laws, rules and regulations as well as
the effectiveness of business controls; overseeing remediation of
compliance risks and issues executed by the businesses and
supporting the identification, escalation and reporting of current,
emerging and reputational compliance risk matters to senior
management and the Board (or appropriate committee). Global
Compliance is also responsible for facilitating processes to
effectively manage regulatory changes and maintain constructive
relationships with regulators.
The Board provides oversight of compliance risks through its
Audit Committee.
Operational Risk Management
The Corporation defines operational risk as the risk of loss
resulting from inadequate or failed internal processes, people and
systems or from external events. Operational risk may occur
anywhere in the Corporation, not solely in operations functions,
and its effects may extend beyond financial losses. Operational
risk includes legal risk. Successful operational risk management
is particularly important to diversified financial services
companies because of the nature, volume and complexity of the
financial services business. Global banking guidelines and
country-specific requirements for managing operational risk were
established in Basel 2 which requires that the Corporation has
internal operational risk management processes to assess and
measure operational risk exposure and to set aside appropriate
capital to address those exposures.
Under the advanced measurement rules of the Basel 2
Framework, an operational loss event is an event that results in
a loss and is associated with any of the following seven operational
loss event categories: internal fraud; external fraud; employment
practices and workplace safety; clients, products and business
practices; damage to physical assets; business disruption and
system failures; and execution, delivery and process management.
Specific examples of loss events include robberies, credit card
fraud, processing errors and physical losses from natural
disasters.