Bank of America 2012 Annual Report Download - page 181
Download and view the complete annual report
Please find page 181 of the 2012 Bank of America annual report below. You can navigate through the pages in the report by either clicking on the pages listed below, or by using the keyword search tool below to find specific information within the annual report.-
 1
1 -
2
-
3
-
4
-
5
-
6
-
7
-
8
-
9
-
10
-
11
-
12
-
13
-
14
-
15
-
16
-
17
-
18
-
19
-
20
-
21
-
22
-
23
-
24
-
25
-
26
-
27
-
28
-
29
-
30
-
31
-
32
-
33
-
34
-
35
-
36
-
37
-
38
-
39
-
40
-
41
-
42
-
43
-
44
-
45
-
46
-
47
-
48
-
49
-
50
-
51
-
52
-
53
-
54
-
55
-
56
-
57
-
58
-
59
-
60
-
61
-
62
-
63
-
64
-
65
-
66
-
67
-
68
-
69
-
70
-
71
-
72
-
73
-
74
-
75
-
76
-
77
-
78
-
79
-
80
-
81
-
82
-
83
-
84
-
85
-
86
-
87
-
88
-
89
-
90
-
91
-
92
-
93
-
94
-
95
-
96
-
97
-
98
-
99
-
100
-
101
-
102
-
103
-
104
-
105
-
106
-
107
-
108
-
109
-
110
-
111
-
112
-
113
-
114
-
115
-
116
-
117
-
118
-
119
-
120
-
121
-
122
-
123
-
124
-
125
-
126
-
127
-
128
-
129
-
130
-
131
-
132
-
133
-
134
-
135
-
136
-
137
-
138
-
139
-
140
-
141
-
142
-
143
-
144
-
145
-
146
-
147
-
148
-
149
-
150
-
151
-
152
-
153
-
154
-
155
-
156
-
157
-
158
-
159
-
160
-
161
-
162
-
163
-
164
-
165
-
166
-
167
-
168
-
169
-
170
-
 171
171 -
 172
172 -
 173
173 -
 174
174 -
 175
175 -
 176
176 -
 177
177 -
 178
178 -
 179
179 -
 180
180 -
 181
181 -
 182
182 -
 183
183 -
 184
184 -
 185
185 -
 186
186 -
 187
187 -
 188
188 -
 189
189 -
 190
190 -
 191
191 -
192
-
193
-
194
-
195
-
196
-
197
-
198
-
199
-
200
-
201
-
202
-
203
-
204
-
205
-
206
-
207
-
208
-
209
-
210
-
211
-
212
-
213
-
214
-
215
-
216
-
217
-
218
-
219
-
220
-
221
-
222
-
223
-
224
-
225
-
226
-
227
-
228
-
229
-
230
-
231
-
232
-
233
-
234
-
235
-
236
-
237
-
238
-
239
-
240
-
241
-
242
-
243
-
244
-
245
-
246
-
247
-
248
-
249
-
250
-
251
-
252
-
253
-
254
-
255
-
256
-
257
-
258
-
259
-
260
-
261
-
262
-
263
-
264
-
265
-
266
-
267
-
268
-
269
-
270
-
271
-
272
-
273
-
274
-
275
-
276
-
277
-
278
-
279
-
280
-
281
-
282
-
283
-
284
 |
 |

Bank of America 2012 179
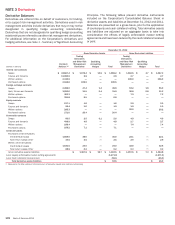
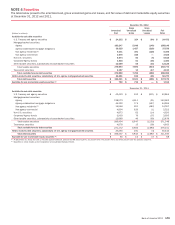
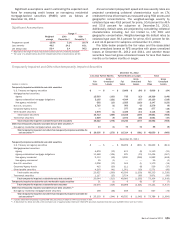
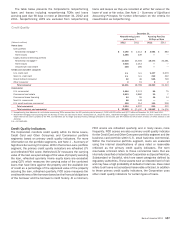
NOTE 4 Securities
The table below presents the amortized cost, gross unrealized gains and losses, and fair value of debt and marketable equity securities
at December 31, 2012 and 2011.
December 31, 2012
(Dollars in millions)
Amortized
Cost
Gross
Unrealized
Gains
Gross
Unrealized
Losses
Fair
Value
Available-for-sale debt securities
U.S. Treasury and agency securities $ 24,232 $ 324 $ (84) $ 24,472
Mortgage-backed securities:
Agency 183,247 5,048 (146) 188,149
Agency-collateralized mortgage obligations 36,329 1,427 (218) 37,538
Non-agency residential (1) 9,231 391 (128) 9,494
Non-agency commercial 3,576 348 — 3,924
Non-U.S. securities 5,574 50 (6) 5,618
Corporate/Agency bonds 1,415 51 (16) 1,450
Other taxable securities, substantially all asset-backed securities 12,089 54 (15) 12,128
Total taxable securities 275,693 7,693 (613) 282,773
Tax-exempt securities 4,167 13 (47) 4,133
Total available-for-sale debt securities 279,860 7,706 (660) 286,906
Held-to-maturity debt securities, substantially all U.S. agency mortgage-backed securities 49,481 815 (26) 50,270
Total debt securities $ 329,341 $ 8,521 $ (686) $ 337,176
Available-for-sale marketable equity securities (2) $780 $732 $—$ 1,512
December 31, 2011
Available-for-sale debt securities
U.S. Treasury and agency securities $ 43,433 $ 242 $ (811) $ 42,864
Mortgage-backed securities:
Agency 138,073 4,511 (21) 142,563
Agency-collateralized mortgage obligations 44,392 774 (167) 44,999
Non-agency residential (1) 14,948 301 (482) 14,767
Non-agency commercial 4,894 629 (1) 5,522
Non-U.S. securities 4,872 62 (14) 4,920
Corporate/Agency bonds 2,993 79 (37) 3,035
Other taxable securities, substantially all asset-backed securities 12,889 49 (60) 12,878
Total taxable securities 266,494 6,647 (1,593) 271,548
Tax-exempt securities 4,678 15 (90) 4,603
Total available-for-sale debt securities 271,172 6,662 (1,683) 276,151
Held-to-maturity debt securities, substantially all U.S. agency mortgage-backed securities 35,265 181 (4) 35,442
Total debt securities $ 306,437 $ 6,843 $ (1,687) $ 311,593
Available-for-sale marketable equity securities (2) $ 65 $ 10 $ (7) $ 68
(1) At December 31, 2012 and 2011, includes approximately 91 percent and 89 percent prime, six percent and nine percent Alt-A, and three percent and two percent subprime.
(2) Classified in other assets on the Corporation’s Consolidated Balance Sheet.