Bank of America 2012 Annual Report Download - page 90
Download and view the complete annual report
Please find page 90 of the 2012 Bank of America annual report below. You can navigate through the pages in the report by either clicking on the pages listed below, or by using the keyword search tool below to find specific information within the annual report.-
 1
1 -
2
-
3
-
4
-
5
-
6
-
7
-
8
-
9
-
10
-
11
-
12
-
13
-
14
-
15
-
16
-
17
-
18
-
19
-
20
-
21
-
22
-
23
-
24
-
25
-
26
-
27
-
28
-
29
-
30
-
31
-
32
-
33
-
34
-
35
-
36
-
37
-
38
-
39
-
40
-
41
-
42
-
43
-
44
-
45
-
46
-
47
-
48
-
49
-
50
-
51
-
52
-
53
-
54
-
55
-
56
-
57
-
58
-
59
-
60
-
61
-
62
-
63
-
64
-
65
-
66
-
67
-
68
-
69
-
70
-
71
-
72
-
73
-
74
-
75
-
76
-
77
-
78
-
79
-
 80
80 -
 81
81 -
 82
82 -
 83
83 -
 84
84 -
 85
85 -
 86
86 -
 87
87 -
 88
88 -
 89
89 -
 90
90 -
 91
91 -
 92
92 -
 93
93 -
 94
94 -
 95
95 -
 96
96 -
 97
97 -
 98
98 -
 99
99 -
 100
100 -
101
-
102
-
103
-
104
-
105
-
106
-
107
-
108
-
109
-
110
-
111
-
112
-
113
-
114
-
115
-
116
-
117
-
118
-
119
-
120
-
121
-
122
-
123
-
124
-
125
-
126
-
127
-
128
-
129
-
130
-
131
-
132
-
133
-
134
-
135
-
136
-
137
-
138
-
139
-
140
-
141
-
142
-
143
-
144
-
145
-
146
-
147
-
148
-
149
-
150
-
151
-
152
-
153
-
154
-
155
-
156
-
157
-
158
-
159
-
160
-
161
-
162
-
163
-
164
-
165
-
166
-
167
-
168
-
169
-
170
-
171
-
172
-
173
-
174
-
175
-
176
-
177
-
178
-
179
-
180
-
181
-
182
-
183
-
184
-
185
-
186
-
187
-
188
-
189
-
190
-
191
-
192
-
193
-
194
-
195
-
196
-
197
-
198
-
199
-
200
-
201
-
202
-
203
-
204
-
205
-
206
-
207
-
208
-
209
-
210
-
211
-
212
-
213
-
214
-
215
-
216
-
217
-
218
-
219
-
220
-
221
-
222
-
223
-
224
-
225
-
226
-
227
-
228
-
229
-
230
-
231
-
232
-
233
-
234
-
235
-
236
-
237
-
238
-
239
-
240
-
241
-
242
-
243
-
244
-
245
-
246
-
247
-
248
-
249
-
250
-
251
-
252
-
253
-
254
-
255
-
256
-
257
-
258
-
259
-
260
-
261
-
262
-
263
-
264
-
265
-
266
-
267
-
268
-
269
-
270
-
271
-
272
-
273
-
274
-
275
-
276
-
277
-
278
-
279
-
280
-
281
-
282
-
283
-
284
 |
 |

88 Bank of America 2012
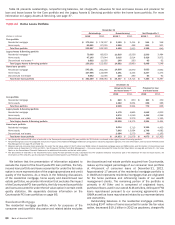
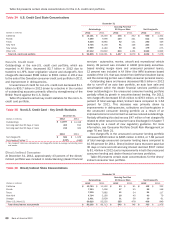
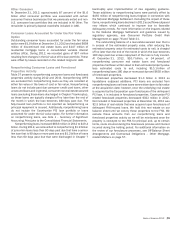
Table 34 presents certain state concentrations for the U.S. credit card portfolio.
Table 34 U.S. Credit Card State Concentrations
December 31
Outstandings
Accruing Past Due
90 Days or More Net Charge-offs
(Dollars in millions) 2012 2011 2012 2011 2012 2011
California $ 14,101 $ 15,246 $235 $ 352 $840 $ 1,402
Florida 7,469 7,999 149 221 512 838
Texas 6,448 6,885 92 131 290 429
New York 5,746 6,156 91 126 263 403
New Jersey 3,959 4,183 60 86 178 275
Other U.S. 57,112 61,822 810 1,154 2,549 3,929
Total U.S. credit card portfolio $ 94,835 $102,291 $ 1,437 $ 2,070 $ 4,632 $ 7,276
Non-U.S. Credit Card
Outstandings in the non-U.S. credit card portfolio, which are
recorded in All Other, decreased $2.7 billion in 2012 due to
transfers to LHFS, lower origination volume and charge-offs. Net
charge-offs decreased $588 million to $581 million in 2012 due
to the sale of the Canadian consumer credit card portfolio in 2011
and improvement in delinquencies.
Unused lines of credit for non-U.S. credit card decreased $1.1
billion to $35.7 billion in 2012 driven by a decline in the number
of outstanding accounts primarily offset by strengthening of the
British Pound against the U.S. Dollar.
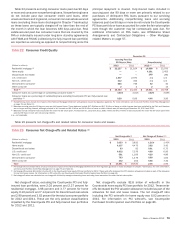
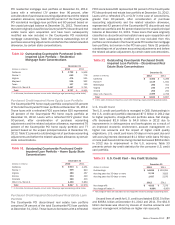
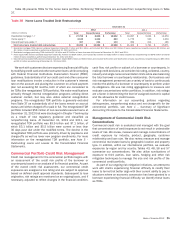
Table 35 presents certain key credit statistics for the non-U.S.
credit card portfolio.
Table 35 Non-U.S. Credit Card – Key Credit Statistics
December 31
(Dollars in millions) 2012 2011
Outstandings $ 11,697 $ 14,418
Accruing past due 30 days or more 403 610
Accruing past due 90 days or more 212 342
2012 2011
Net charge-offs $ 581 $ 1,169
Net charge-off ratios (1) 4.29% 4.86%
(1) Net charge-off ratios are calculated as net charge-offs divided by average outstanding loans
and leases.
Direct/Indirect Consumer
At December 31, 2012, approximately 43 percent of the direct/
indirect portfolio was included in Global Banking (dealer financial
services - automotive, marine, aircraft and recreational vehicle
loans), 39 percent was included in GWIM (principally securities-
based lending margin loans and unsecured personal loans),
12 percent was included in All Other (the IWM business based
outside of the U.S. that was moved from GWIM and student loans)
and the remaining portion was in CBB (consumer personal loans).
Outstanding loans and leases decreased $6.5 billion in 2012
due to run-off of an auto loan portfolio, an auto loan sale and
securitization within the dealer financial services portfolio and
lower outstandings in the unsecured consumer lending portfolio
partially offset by growth in securities-based lending. For 2012,
net charge-offs decreased $713 million to $763 million, or 0.90
percent of total average direct/indirect loans compared to 1.64
percent for 2011. This decrease was primarily driven by
improvements in delinquencies, collections and bankruptcies in
the unsecured consumer lending portfolio as a result of an
improved economic environment as well as reduced outstandings.
Partially offsetting this decline was $47 million of net charge-offs
related to other secured consumer loans discharged in Chapter 7
bankruptcy as a result of new regulatory guidance. For more
information, see Consumer Portfolio Credit Risk Management on
page 76 and Table 21.
Net charge-offs in the unsecured consumer lending portfolio
decreased $610 million to $485 million in 2012, or 7.68 percent
of total average unsecured consumer lending loans compared to
10.93 percent for 2011. Direct/indirect loans that were past due
30 days or more and still accruing interest declined $537 million
to $1.4 billion in 2012 due to improvements in both the unsecured
consumer lending and dealer financial services portfolios.
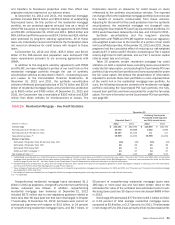
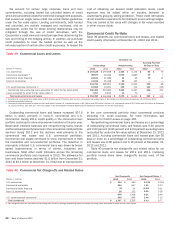
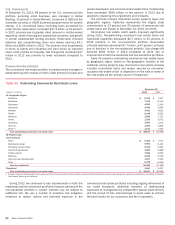
Table 36 presents certain state concentrations for the direct/
indirect consumer loan portfolio.
Table 36 Direct/Indirect State Concentrations
December 31
Outstandings
Accruing Past Due
90 Days or More Net Charge-offs
(Dollars in millions) 2012 2011 2012 2011 2012 2011
California $ 10,793 $ 11,152 $ 53 $ 81 $102 $ 222
Florida 7,363 7,456 37 55 88 148
Texas 7,239 7,882 41 54 64 117
New York 4,794 5,160 28 40 43 79
Georgia 2,491 2,828 31 38 30 61
Other U.S./Non-U.S. 50,525 55,235 355 478 436 849
Total direct/indirect loan portfolio $ 83,205 $ 89,713 $545 $ 746 $763 $ 1,476