Bank of America 2012 Annual Report Download - page 48
Download and view the complete annual report
Please find page 48 of the 2012 Bank of America annual report below. You can navigate through the pages in the report by either clicking on the pages listed below, or by using the keyword search tool below to find specific information within the annual report.-
 1
1 -
2
-
3
-
4
-
5
-
6
-
7
-
8
-
9
-
10
-
11
-
12
-
13
-
14
-
15
-
16
-
17
-
18
-
19
-
20
-
21
-
22
-
23
-
24
-
25
-
26
-
27
-
28
-
29
-
30
-
31
-
32
-
33
-
34
-
35
-
36
-
37
-
 38
38 -
 39
39 -
 40
40 -
 41
41 -
 42
42 -
 43
43 -
 44
44 -
 45
45 -
 46
46 -
 47
47 -
 48
48 -
 49
49 -
 50
50 -
 51
51 -
 52
52 -
 53
53 -
 54
54 -
 55
55 -
 56
56 -
 57
57 -
 58
58 -
59
-
60
-
61
-
62
-
63
-
64
-
65
-
66
-
67
-
68
-
69
-
70
-
71
-
72
-
73
-
74
-
75
-
76
-
77
-
78
-
79
-
80
-
81
-
82
-
83
-
84
-
85
-
86
-
87
-
88
-
89
-
90
-
91
-
92
-
93
-
94
-
95
-
96
-
97
-
98
-
99
-
100
-
101
-
102
-
103
-
104
-
105
-
106
-
107
-
108
-
109
-
110
-
111
-
112
-
113
-
114
-
115
-
116
-
117
-
118
-
119
-
120
-
121
-
122
-
123
-
124
-
125
-
126
-
127
-
128
-
129
-
130
-
131
-
132
-
133
-
134
-
135
-
136
-
137
-
138
-
139
-
140
-
141
-
142
-
143
-
144
-
145
-
146
-
147
-
148
-
149
-
150
-
151
-
152
-
153
-
154
-
155
-
156
-
157
-
158
-
159
-
160
-
161
-
162
-
163
-
164
-
165
-
166
-
167
-
168
-
169
-
170
-
171
-
172
-
173
-
174
-
175
-
176
-
177
-
178
-
179
-
180
-
181
-
182
-
183
-
184
-
185
-
186
-
187
-
188
-
189
-
190
-
191
-
192
-
193
-
194
-
195
-
196
-
197
-
198
-
199
-
200
-
201
-
202
-
203
-
204
-
205
-
206
-
207
-
208
-
209
-
210
-
211
-
212
-
213
-
214
-
215
-
216
-
217
-
218
-
219
-
220
-
221
-
222
-
223
-
224
-
225
-
226
-
227
-
228
-
229
-
230
-
231
-
232
-
233
-
234
-
235
-
236
-
237
-
238
-
239
-
240
-
241
-
242
-
243
-
244
-
245
-
246
-
247
-
248
-
249
-
250
-
251
-
252
-
253
-
254
-
255
-
256
-
257
-
258
-
259
-
260
-
261
-
262
-
263
-
264
-
265
-
266
-
267
-
268
-
269
-
270
-
271
-
272
-
273
-
274
-
275
-
276
-
277
-
278
-
279
-
280
-
281
-
282
-
283
-
284
 |
 |

46 Bank of America 2012
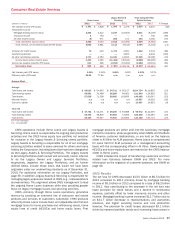
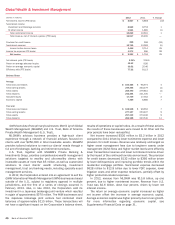
Global Wealth & Investment Management
(Dollars in millions) 2012 2011 % Change
Net interest income (FTE basis) $ 5,827 $ 5,885 (1)%
Noninterest income:
Investment and brokerage services 8,849 8,750 1
All other income 1,841 1,860 (1)
Total noninterest income 10,690 10,610 1
Total revenue, net of interest expense (FTE basis) 16,517 16,495 —
Provision for credit losses 266 398 (33)
Noninterest expense 12,755 13,383 (5)
Income before income taxes 3,496 2,714 29
Income tax expense (FTE basis) 1,273 996 28
Net income $ 2,223 $ 1,718 29
Net interest yield (FTE basis) 2.34%2.26%
Return on average allocated equity 12.53 9.90
Return on average economic capital 30.52 25.46
Efficiency ratio (FTE basis) 77.22 81.13
Balance Sheet
Average
Total loans and leases $ 100,456 $ 96,974 4
Total earning assets 249,368 260,479 (4)
Total assets 268,490 279,815 (4)
Total deposits 242,384 241,535 —
Allocated equity 17,739 17,352 2
Economic capital 7,359 6,866 7
Year end
Total loans and leases $ 105,928 $ 98,654 7
Total earning assets 277,107 253,407 9
Total assets 297,330 273,106 9
Total deposits 266,188 240,540 11
GWIM consists of two primary businesses: Merrill Lynch Global
Wealth Management (MLGWM) and U.S. Trust, Bank of America
Private Wealth Management (U.S. Trust).
MLGWM’s advisory business provides a high-touch client
experience through a network of financial advisors focused on
clients with over $250,000 in total investable assets. MLGWM
provides tailored solutions to meet our clients’ needs through a
full set of brokerage, banking and retirement products.
U.S. Trust, together with MLGWM’s Private Banking &
Investments Group, provides comprehensive wealth management
solutions targeted to wealthy and ultra-wealthy clients with
investable assets of more than $5 million, as well as customized
solutions to meet clients’ wealth structuring, investment
management, trust and banking needs, including specialty asset
management services.
In 2012, the Corporation entered into an agreement to sell the
GWIM International Wealth Management (IWM) businesses based
outside of the U.S., subject to regulatory approval in multiple
jurisdictions, and the first of a series of closings occurred in
February 2013. Also, in late 2012, the Corporation sold its
investment in a Japanese brokerage joint venture which resulted
in a gain of approximately $370 million. The IWM businesses and
the Japanese brokerage joint venture had combined client
balances of approximately $115 billion. These transactions will
not have a significant impact on the Corporation’s balance sheet,
results of operations or capital ratios. As a result of these actions,
the results of these businesses were moved to All Other and the
prior periods have been reclassified.
Net income increased $505 million to $2.2 billion in 2012
compared to 2011 driven by lower noninterest expense and lower
provision for credit losses. Revenue was relatively unchanged as
higher asset management fees due to long-term assets under
management (AUM) flows and higher market levels were offset by
lower transactional revenue and lower net interest income driven
by the impact of the continued low rate environment. The provision
for credit losses decreased $132 million to $266 million driven
by lower delinquencies and improving portfolio trends within the
residential mortgage portfolio. Noninterest expense decreased
$628 million to $12.8 billion due to lower FDIC expense, lower
litigation costs and other expense reductions, partially offset by
higher production-related expenses.
In 2012, revenue from MLGWM was $13.8 billion, up one
percent, due to higher noninterest income. Revenue from U.S.
Trust was $2.6 billion, down four percent, driven by lower net
interest income.
The return on average economic capital increased as higher
net income offset the increase in average economic capital.
Average economic capital was higher primarily due to loan growth.
For more information regarding economic capital, see
Supplemental Financial Data on page 31.