Bank of America 2012 Annual Report Download - page 209
Download and view the complete annual report
Please find page 209 of the 2012 Bank of America annual report below. You can navigate through the pages in the report by either clicking on the pages listed below, or by using the keyword search tool below to find specific information within the annual report.-
 1
1 -
2
-
3
-
4
-
5
-
6
-
7
-
8
-
9
-
10
-
11
-
12
-
13
-
14
-
15
-
16
-
17
-
18
-
19
-
20
-
21
-
22
-
23
-
24
-
25
-
26
-
27
-
28
-
29
-
30
-
31
-
32
-
33
-
34
-
35
-
36
-
37
-
38
-
39
-
40
-
41
-
42
-
43
-
44
-
45
-
46
-
47
-
48
-
49
-
50
-
51
-
52
-
53
-
54
-
55
-
56
-
57
-
58
-
59
-
60
-
61
-
62
-
63
-
64
-
65
-
66
-
67
-
68
-
69
-
70
-
71
-
72
-
73
-
74
-
75
-
76
-
77
-
78
-
79
-
80
-
81
-
82
-
83
-
84
-
85
-
86
-
87
-
88
-
89
-
90
-
91
-
92
-
93
-
94
-
95
-
96
-
97
-
98
-
99
-
100
-
101
-
102
-
103
-
104
-
105
-
106
-
107
-
108
-
109
-
110
-
111
-
112
-
113
-
114
-
115
-
116
-
117
-
118
-
119
-
120
-
121
-
122
-
123
-
124
-
125
-
126
-
127
-
128
-
129
-
130
-
131
-
132
-
133
-
134
-
135
-
136
-
137
-
138
-
139
-
140
-
141
-
142
-
143
-
144
-
145
-
146
-
147
-
148
-
149
-
150
-
151
-
152
-
153
-
154
-
155
-
156
-
157
-
158
-
159
-
160
-
161
-
162
-
163
-
164
-
165
-
166
-
167
-
168
-
169
-
170
-
171
-
172
-
173
-
174
-
175
-
176
-
177
-
178
-
179
-
180
-
181
-
182
-
183
-
184
-
185
-
186
-
187
-
188
-
189
-
190
-
191
-
192
-
193
-
194
-
195
-
196
-
197
-
198
-
 199
199 -
 200
200 -
 201
201 -
 202
202 -
 203
203 -
 204
204 -
 205
205 -
 206
206 -
 207
207 -
 208
208 -
 209
209 -
 210
210 -
 211
211 -
 212
212 -
 213
213 -
 214
214 -
 215
215 -
 216
216 -
 217
217 -
 218
218 -
 219
219 -
220
-
221
-
222
-
223
-
224
-
225
-
226
-
227
-
228
-
229
-
230
-
231
-
232
-
233
-
234
-
235
-
236
-
237
-
238
-
239
-
240
-
241
-
242
-
243
-
244
-
245
-
246
-
247
-
248
-
249
-
250
-
251
-
252
-
253
-
254
-
255
-
256
-
257
-
258
-
259
-
260
-
261
-
262
-
263
-
264
-
265
-
266
-
267
-
268
-
269
-
270
-
271
-
272
-
273
-
274
-
275
-
276
-
277
-
278
-
279
-
280
-
281
-
282
-
283
-
284
 |
 |

Bank of America 2012 207
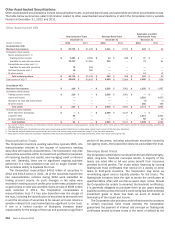
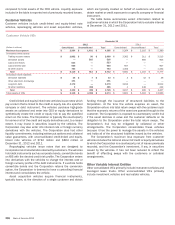
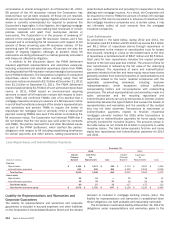
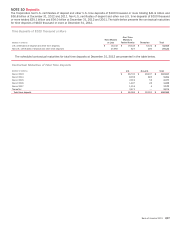
The table below summarizes select information related to other VIEs in which the Corporation held a variable interest at December 31,
2012 and 2011.
Other VIEs
December 31
2012 2011
(Dollars in millions) Consolidated Unconsolidated Total Consolidated Unconsolidated Total
Maximum loss exposure $ 5,608 $ 6,492 $ 12,100 $ 7,429 $ 7,286 $ 14,715
On-balance sheet assets
Trading account assets $ 108 $ —$ 108 $—$—$—
Derivative assets — 460 460 394 440 834
Available-for-sale debt securities — 39 39 — 62 62
Loans and leases 4,561 67 4,628 5,154 357 5,511
Allowance for loan and lease losses (14) — (14) (8)(1) (9)
Loans held-for-sale 105 157 262 106 598 704
All other assets 1,001 5,768 6,769 1,809 5,823 7,632
Total $ 5,761 $ 6,491 $ 12,252 $ 7,455 $ 7,279 $ 14,734
On-balance sheet liabilities
Derivative liabilities $—$9$9
$—$—$—
Long-term debt 889 — 889 10 — 10
All other liabilities 63 1,683 1,746 694 1,705 2,399
Total $ 952 $ 1,692 $ 2,644 $ 704 $ 1,705 $ 2,409
Total assets of VIEs $ 5,761 $ 8,660 $ 14,421 $ 7,455 $ 11,055 $ 18,510
Investment Vehicles
The Corporation sponsors, invests in or provides financing to a
variety of investment vehicles that hold loans, real estate, debt
securities or other financial instruments and are designed to
provide the desired investment profile to investors or the
Corporation. At December 31, 2012 and 2011, the Corporation’s
consolidated investment vehicles had total assets of $1.3 billion
and $2.6 billion. The Corporation also held investments in
unconsolidated vehicles with total assets of $3.0 billion and $5.5
billion at December 31, 2012 and 2011. The Corporation’s
maximum loss exposure associated with both consolidated and
unconsolidated investment vehicles totaled $2.1 billion and $4.4
billion at December 31, 2012 and 2011 comprised primarily of
on-balance sheet assets less non-recourse liabilities.
Leveraged Lease Trusts
The Corporation’s net investment in consolidated leveraged lease
trusts totaled $4.4 billion and $4.8 billion at December 31, 2012
and 2011. The trusts hold long-lived equipment such as rail cars,
power generation and distribution equipment, and commercial
aircraft. The Corporation structures the trusts and holds a
significant residual interest. The net investment represents the
Corporation’s maximum loss exposure to the trusts in the unlikely
event that the leveraged lease investments become worthless.
Debt issued by the leveraged lease trusts is non-recourse to the
Corporation. The Corporation has no liquidity exposure to these
leveraged lease trusts.
Real Estate Vehicles
The Corporation held investments in unconsolidated real estate
vehicles of $5.4 billion at both December 31, 2012 and 2011,
which primarily consist of investments in unconsolidated limited
partnerships that finance the construction and rehabilitation of
affordable rental housing and commercial real estate. An unrelated
third party is typically the general partner and has control over the
significant activities of the partnership. The Corporation earns a
return primarily through the receipt of tax credits allocated to the
real estate projects. The Corporation’s risk of loss is mitigated by
policies requiring that the project qualify for the expected tax
credits prior to making its investment. The Corporation may from
time to time be asked to invest additional amounts to support a
troubled project. Such additional investments have not been and
are not expected to be significant.
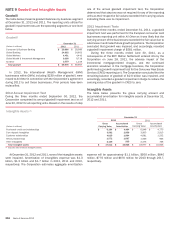
Other Asset-backed Financing Arrangements
The Corporation transferred pools of securities to certain
independent third parties and provided financing for up to 75
percent of the purchase price under asset-backed financing
arrangements. At December 31, 2012 and 2011, the
Corporation’s maximum loss exposure under these financing
arrangements was $2.5 billion and $4.7 billion, substantially all
of which were classified as loans on the Corporation’s
Consolidated Balance Sheet. All principal and interest payments
have been received when due in accordance with their contractual
terms. These arrangements are not included in the Other VIEs
table because the purchasers are not VIEs.
NOTE 8 Representations and Warranties
Obligations and Corporate Guarantees
Background
The Corporation securitizes first-lien residential mortgage loans
generally in the form of MBS guaranteed by the GSEs or by GNMA
in the case of FHA-insured, VA-guaranteed and Rural Housing
Service-guaranteed mortgage loans. In addition, in prior years,
legacy companies and certain subsidiaries sold pools of first-lien
residential mortgage loans and home equity loans as private-label
securitizations (in certain of these securitizations, monolines or
financial guarantee providers insured all or some of the securities)
or in the form of whole loans. In connection with these transactions,
the Corporation or certain of its subsidiaries or legacy companies
make or have made various representations and warranties. These
representations and warranties, as set forth in the agreements,