Bank of America 2012 Annual Report Download - page 261
Download and view the complete annual report
Please find page 261 of the 2012 Bank of America annual report below. You can navigate through the pages in the report by either clicking on the pages listed below, or by using the keyword search tool below to find specific information within the annual report.-
 1
1 -
2
-
3
-
4
-
5
-
6
-
7
-
8
-
9
-
10
-
11
-
12
-
13
-
14
-
15
-
16
-
17
-
18
-
19
-
20
-
21
-
22
-
23
-
24
-
25
-
26
-
27
-
28
-
29
-
30
-
31
-
32
-
33
-
34
-
35
-
36
-
37
-
38
-
39
-
40
-
41
-
42
-
43
-
44
-
45
-
46
-
47
-
48
-
49
-
50
-
51
-
52
-
53
-
54
-
55
-
56
-
57
-
58
-
59
-
60
-
61
-
62
-
63
-
64
-
65
-
66
-
67
-
68
-
69
-
70
-
71
-
72
-
73
-
74
-
75
-
76
-
77
-
78
-
79
-
80
-
81
-
82
-
83
-
84
-
85
-
86
-
87
-
88
-
89
-
90
-
91
-
92
-
93
-
94
-
95
-
96
-
97
-
98
-
99
-
100
-
101
-
102
-
103
-
104
-
105
-
106
-
107
-
108
-
109
-
110
-
111
-
112
-
113
-
114
-
115
-
116
-
117
-
118
-
119
-
120
-
121
-
122
-
123
-
124
-
125
-
126
-
127
-
128
-
129
-
130
-
131
-
132
-
133
-
134
-
135
-
136
-
137
-
138
-
139
-
140
-
141
-
142
-
143
-
144
-
145
-
146
-
147
-
148
-
149
-
150
-
151
-
152
-
153
-
154
-
155
-
156
-
157
-
158
-
159
-
160
-
161
-
162
-
163
-
164
-
165
-
166
-
167
-
168
-
169
-
170
-
171
-
172
-
173
-
174
-
175
-
176
-
177
-
178
-
179
-
180
-
181
-
182
-
183
-
184
-
185
-
186
-
187
-
188
-
189
-
190
-
191
-
192
-
193
-
194
-
195
-
196
-
197
-
198
-
199
-
200
-
201
-
202
-
203
-
204
-
205
-
206
-
207
-
208
-
209
-
210
-
211
-
212
-
213
-
214
-
215
-
216
-
217
-
218
-
219
-
220
-
221
-
222
-
223
-
224
-
225
-
226
-
227
-
228
-
229
-
230
-
231
-
232
-
233
-
234
-
235
-
236
-
237
-
238
-
239
-
240
-
241
-
242
-
243
-
244
-
245
-
246
-
247
-
248
-
249
-
250
-
 251
251 -
 252
252 -
 253
253 -
 254
254 -
 255
255 -
 256
256 -
 257
257 -
 258
258 -
 259
259 -
 260
260 -
 261
261 -
 262
262 -
 263
263 -
 264
264 -
 265
265 -
 266
266 -
 267
267 -
 268
268 -
 269
269 -
 270
270 -
 271
271 -
272
-
273
-
274
-
275
-
276
-
277
-
278
-
279
-
280
-
281
-
282
-
283
-
284
 |
 |

Bank of America 2012 259
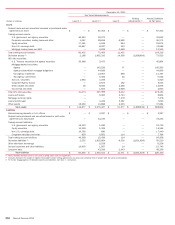
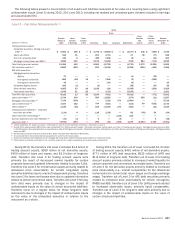
Level 3 – Fair Value Measurements (1)
2010
(Dollars in millions)
Balance
January 1
2010
Consolidation
of VIEs
Gains
(Losses)
in Earnings
Gains
(Losses)
in OCI
Purchases,
Issuances
and
Settlements
Gross
Transfers
into
Level 3
Gross
Transfers
out of
Level 3
Balance
December 31
2010
Trading account assets:
Corporate securities, trading loans and other $ 11,080 $ 117 $ 848 $ — $ (4,852) $ 2,599 $ (2,041) $ 7,751
Equity securities 1,084 — (81) — (342) 131 (169) 623
Non-U.S. sovereign debt 1,143 — (138) — (157) 115 (720) 243
Mortgage trading loans and ABS 7,770 175 653 — (1,659) 396 (427) 6,908
Total trading account assets 21,077 292 1,282 — (7,010) 3,241 (3,357) 15,525
Net derivative assets (2) 7,863 — 8,118 — (8,778) 1,067 (525) 7,745
AFS debt securities:
Mortgage-backed securities:
Agency ———— 4 —— 4
Non-agency residential 7,216 113 (646) (169) (6,767) 1,909 (188) 1,468
Non-agency commercial 258 — (13) (31) (178) 71 (88) 19
Non-U.S. securities 468 — (125) (75) (321) 56 — 3
Corporate/Agency bonds 927 — (3) 47 (847) 32 (19) 137
Other taxable securities 9,854 5,603 (296) 44 (3,263) 1,119 (43) 13,018
Tax-exempt securities 1,623 — (25) (9) (574) 316 (107) 1,224
Total AFS debt securities 20,346 5,716 (1,108) (193) (11,946) 3,503 (445) 15,873
Loans and leases (3) 4,936 — (89) — (1,526) — — 3,321
Mortgage servicing rights 19,465 — (4,321) — (244) — — 14,900
Loans held-for-sale (3) 6,942 — 482 — (3,714) 624 (194) 4,140
Other assets (4) 7,821 — 1,946 — (2,612) — (299) 6,856
Trading account liabilities:
Non-U.S. sovereign debt (386) — 23 — (17) — 380 —
Corporate securities and other (10) — (5) — 11 (52) 49 (7)
Total trading account liabilities (396) — 18 — (6) (52) 429 (7)
Other short-term borrowings (3) (707) — (95) — 96 — — (706)
Accrued expenses and other liabilities (3) (891) — 146 — (83) — — (828)
Long-term debt (3) (4,660) — 697 — 1,074 (1,881) 1,784 (2,986)
(1) Assets (liabilities). For assets, increase / (decrease) to Level 3 and for liabilities, (increase) / decrease to Level 3.
(2) Net derivatives include derivative assets of $18.8 billion and derivative liabilities of $11.0 billion.
(3) Amounts represent instruments that are accounted for under the fair value option.
(4) Other assets is primarily comprised of AFS marketable equity securities.
During 2010, the transfers into Level 3 included $3.2 billion of
trading account assets, $3.5 billion of AFS debt securities, $1.1
billion of net derivative assets and $1.9 billion of long-term debt.
Transfers into Level 3 for trading account assets were due to
reduced price transparency as a result of lower levels of trading
activity for certain municipal ARS and corporate debt securities as
well as a change in valuation methodology for certain ABS to a
discounted cash flow model. Transfers into Level 3 for AFS debt
securities were due to an increase in the number of non-agency
RMBS and other taxable securities priced using a discounted cash
flow model. Transfers into Level 3 for net derivative contracts were
primarily related to a lack of price observability for certain credit
default and total return swaps. Transfers into Level 3 for long-term
debt were primarily due to changes in the impact of unobservable
inputs on the value of certain structured liabilities. Transfers occur
on a regular basis for these long-term debt instruments due to
changes in the impact of unobservable inputs on the value of the
embedded derivative in relation to the instrument as a whole.
During 2010, the transfers out of Level 3 included $3.4 billion
of trading account assets and $1.8 billion of long-term debt.
Transfers out of Level 3 for trading account assets were due to
increased price verification of certain MBS, corporate debt and
non-U.S. government and agency securities. Transfers out of Level
3 for long-term debt were primarily due to changes in the impact
of unobservable inputs on the value of certain structured liabilities.