Bank of America 2012 Annual Report Download - page 87
Download and view the complete annual report
Please find page 87 of the 2012 Bank of America annual report below. You can navigate through the pages in the report by either clicking on the pages listed below, or by using the keyword search tool below to find specific information within the annual report.-
 1
1 -
2
-
3
-
4
-
5
-
6
-
7
-
8
-
9
-
10
-
11
-
12
-
13
-
14
-
15
-
16
-
17
-
18
-
19
-
20
-
21
-
22
-
23
-
24
-
25
-
26
-
27
-
28
-
29
-
30
-
31
-
32
-
33
-
34
-
35
-
36
-
37
-
38
-
39
-
40
-
41
-
42
-
43
-
44
-
45
-
46
-
47
-
48
-
49
-
50
-
51
-
52
-
53
-
54
-
55
-
56
-
57
-
58
-
59
-
60
-
61
-
62
-
63
-
64
-
65
-
66
-
67
-
68
-
69
-
70
-
71
-
72
-
73
-
74
-
75
-
76
-
 77
77 -
 78
78 -
 79
79 -
 80
80 -
 81
81 -
 82
82 -
 83
83 -
 84
84 -
 85
85 -
 86
86 -
 87
87 -
 88
88 -
 89
89 -
 90
90 -
 91
91 -
 92
92 -
 93
93 -
 94
94 -
 95
95 -
 96
96 -
 97
97 -
98
-
99
-
100
-
101
-
102
-
103
-
104
-
105
-
106
-
107
-
108
-
109
-
110
-
111
-
112
-
113
-
114
-
115
-
116
-
117
-
118
-
119
-
120
-
121
-
122
-
123
-
124
-
125
-
126
-
127
-
128
-
129
-
130
-
131
-
132
-
133
-
134
-
135
-
136
-
137
-
138
-
139
-
140
-
141
-
142
-
143
-
144
-
145
-
146
-
147
-
148
-
149
-
150
-
151
-
152
-
153
-
154
-
155
-
156
-
157
-
158
-
159
-
160
-
161
-
162
-
163
-
164
-
165
-
166
-
167
-
168
-
169
-
170
-
171
-
172
-
173
-
174
-
175
-
176
-
177
-
178
-
179
-
180
-
181
-
182
-
183
-
184
-
185
-
186
-
187
-
188
-
189
-
190
-
191
-
192
-
193
-
194
-
195
-
196
-
197
-
198
-
199
-
200
-
201
-
202
-
203
-
204
-
205
-
206
-
207
-
208
-
209
-
210
-
211
-
212
-
213
-
214
-
215
-
216
-
217
-
218
-
219
-
220
-
221
-
222
-
223
-
224
-
225
-
226
-
227
-
228
-
229
-
230
-
231
-
232
-
233
-
234
-
235
-
236
-
237
-
238
-
239
-
240
-
241
-
242
-
243
-
244
-
245
-
246
-
247
-
248
-
249
-
250
-
251
-
252
-
253
-
254
-
255
-
256
-
257
-
258
-
259
-
260
-
261
-
262
-
263
-
264
-
265
-
266
-
267
-
268
-
269
-
270
-
271
-
272
-
273
-
274
-
275
-
276
-
277
-
278
-
279
-
280
-
281
-
282
-
283
-
284
 |
 |

Bank of America 2012 85
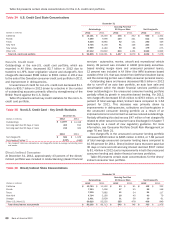
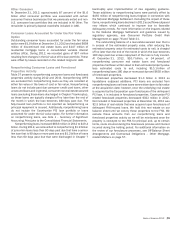
2012 and 2011. The Los Angeles-Long Beach-Santa Ana MSA
within California made up 12 percent of the outstanding home
equity portfolio at both December 31, 2012 and 2011. This MSA
comprised 11 percent and 12 percent of net charge-offs in 2012
and 2011.
For information on representations and warranties related to
our home equity portfolio, see Off-Balance Sheet Arrangements
and Contractual Obligations – Representations and Warranties on
page 50 and Note 8 – Representations and Warranties Obligations
and Corporate Guarantees to the Consolidated Financial
Statements.
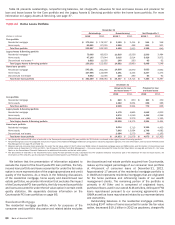
Table 28 Home Equity State Concentrations
December 31
Outstandings Nonperforming Net Charge-offs
(Dollars in millions) 2012 2011 2012 (1) 2011 2012 (1, 2) 2011
California $ 28,728 $ 32,398 $ 1,127 $ 627 $ 1,333 $ 1,481
Florida (3) 11,898 13,450 706 411 602 853
New Jersey (3) 6,788 7,483 312 175 210 164
New York (3) 6,734 7,423 419 242 222 196
Massachusetts 4,381 4,919 140 67 91 71
Other U.S./Non-U.S. 40,920 47,048 1,577 931 1,779 1,708
Home equity loans (4) $ 99,449 $112,721 $ 4,281 $ 2,453 $ 4,237 $ 4,473
Countrywide purchased credit-impaired home equity portfolio 8,547 11,978
Total home equity loan portfolio $ 107,996 $124,699
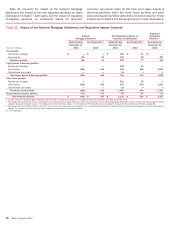
(1) Nonperforming loans and net charge-offs include the impacts of the National Mortgage Settlement and guidance issued by regulatory agencies. For more information, see Consumer Portfolio Credit
Risk Management on page 76 and Table 21.
(2) Net charge-offs exclude $2.8 billion of write-offs in the Countrywide home equity PCI loan portfolio for 2012. These write-offs decreased the PCI valuation allowance included as part of the allowance
for loan and lease losses. For information on PCI write-offs, see Countrywide Purchased Credit-impaired Loan Portfolio on page 86.
(3) In these states, foreclosure requires a court order following a legal proceeding (judicial states).
(4) Amount excludes the Countrywide PCI home equity loan portfolio.
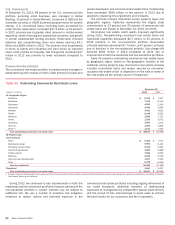
Discontinued Real Estate
The discontinued real estate portfolio, excluding $858 million of
loans accounted for under the fair value option, totaled $9.9 billion
at December 31, 2012 and consists of pay option and subprime
loans acquired in the Countrywide acquisition. Upon acquisition,
the majority of the discontinued real estate portfolio was
considered credit-impaired and written down to fair value. At
December 31, 2012, the Countrywide PCI loan portfolio was $8.8
billion, or 89 percent of the total discontinued real estate portfolio.
This portfolio is included in All Other and is managed as part of
our overall ALM activities. See Countrywide Purchased Credit-
impaired Loan Portfolio on page 86 for more information on the
discontinued real estate portfolio. At December 31, 2012, the
purchased discontinued real estate portfolio that was not credit-
impaired was $1.1 billion. Loans with greater than 90 percent
refreshed LTVs and CLTVs comprised 32 percent of the portfolio
and those with refreshed FICO scores below 620 represented
41 percent of the portfolio. The Los Angeles-Long Beach-Santa
Ana MSA within California made up 16 percent of outstanding
discontinued real estate loans at December 31, 2012.
Pay option adjustable-rate mortgages (ARMs), which are
included in the discontinued real estate portfolio, have interest
rates that adjust monthly and minimum required payments that
adjust annually, subject to resetting if minimum payments are
made and deferred interest limits are reached. Annual payment
adjustments are subject to a 7.5 percent maximum change. To
ensure that contractual loan payments are adequate to repay a
loan, the fully-amortizing loan payment amount is re-established
after the initial five- or 10-year period and again every five years
thereafter. These payment adjustments are not subject to the 7.5
percent limit and may be substantial due to changes in interest
rates and the addition of unpaid interest to the loan balance.
Payment advantage ARMs have interest rates that are fixed for an
initial period of five years. Payments are subject to reset if the
minimum payments are made and deferred interest limits are
reached. If interest deferrals cause a loan’s principal balance to
reach a certain level within the first 10 years of the life of the loan,
the payment is reset to the interest-only payment; then at the 10-
year point, the fully-amortizing payment is required.
The difference between the frequency of changes in a loan’s
interest rates and payments along with a limitation on changes in
the minimum monthly payments of 7.5 percent per year can result
in payments that are not sufficient to pay all of the monthly interest
charges (i.e., negative amortization). Unpaid interest is added to
the loan balance until the loan balance increases to a specified
limit, which can be no more than 115 percent of the original loan
amount, at which time a new monthly payment amount adequate
to repay the loan over its remaining contractual life is established.
At December 31, 2012, the unpaid principal balance of pay
option loans was $9.4 billion, with a carrying amount of
$8.8 billion, including $8.1 billion of loans that were credit-
impaired upon acquisition, and accordingly, the reserve is based
on a life-of-loan loss estimate. The total unpaid principal balance
of pay option loans with accumulated negative amortization was
$6.4 billion including $464 million of negative amortization. For
those borrowers who are making payments in accordance with
their contractual terms, 17 percent and 22 percent at December
31, 2012 and 2011 elected to make only the minimum payment
on option ARMs. We believe the majority of borrowers are now
making scheduled payments primarily because the low rate
environment has caused the fully indexed rates to be affordable
to more borrowers. We continue to evaluate our exposure to
payment resets on the acquired negative-amortizing loans
including the Countrywide PCI pay option loan portfolio and have
taken into consideration several assumptions regarding this
evaluation including prepayment and default rates. Of the loans
in the pay option portfolio at December 31, 2012 that have not
already experienced a payment reset, one percent are expected
to reset in 2013 and approximately 23 percent thereafter. In
addition, seven percent are expected to prepay and 69 percent
are expected to default prior to being reset, most of which were
severely delinquent as of December 31, 2012.