Bank of America 2012 Annual Report Download - page 177
Download and view the complete annual report
Please find page 177 of the 2012 Bank of America annual report below. You can navigate through the pages in the report by either clicking on the pages listed below, or by using the keyword search tool below to find specific information within the annual report.-
 1
1 -
2
-
3
-
4
-
5
-
6
-
7
-
8
-
9
-
10
-
11
-
12
-
13
-
14
-
15
-
16
-
17
-
18
-
19
-
20
-
21
-
22
-
23
-
24
-
25
-
26
-
27
-
28
-
29
-
30
-
31
-
32
-
33
-
34
-
35
-
36
-
37
-
38
-
39
-
40
-
41
-
42
-
43
-
44
-
45
-
46
-
47
-
48
-
49
-
50
-
51
-
52
-
53
-
54
-
55
-
56
-
57
-
58
-
59
-
60
-
61
-
62
-
63
-
64
-
65
-
66
-
67
-
68
-
69
-
70
-
71
-
72
-
73
-
74
-
75
-
76
-
77
-
78
-
79
-
80
-
81
-
82
-
83
-
84
-
85
-
86
-
87
-
88
-
89
-
90
-
91
-
92
-
93
-
94
-
95
-
96
-
97
-
98
-
99
-
100
-
101
-
102
-
103
-
104
-
105
-
106
-
107
-
108
-
109
-
110
-
111
-
112
-
113
-
114
-
115
-
116
-
117
-
118
-
119
-
120
-
121
-
122
-
123
-
124
-
125
-
126
-
127
-
128
-
129
-
130
-
131
-
132
-
133
-
134
-
135
-
136
-
137
-
138
-
139
-
140
-
141
-
142
-
143
-
144
-
145
-
146
-
147
-
148
-
149
-
150
-
151
-
152
-
153
-
154
-
155
-
156
-
157
-
158
-
159
-
160
-
161
-
162
-
163
-
164
-
165
-
166
-
 167
167 -
 168
168 -
 169
169 -
 170
170 -
 171
171 -
 172
172 -
 173
173 -
 174
174 -
 175
175 -
 176
176 -
 177
177 -
 178
178 -
 179
179 -
 180
180 -
 181
181 -
 182
182 -
 183
183 -
 184
184 -
 185
185 -
 186
186 -
 187
187 -
188
-
189
-
190
-
191
-
192
-
193
-
194
-
195
-
196
-
197
-
198
-
199
-
200
-
201
-
202
-
203
-
204
-
205
-
206
-
207
-
208
-
209
-
210
-
211
-
212
-
213
-
214
-
215
-
216
-
217
-
218
-
219
-
220
-
221
-
222
-
223
-
224
-
225
-
226
-
227
-
228
-
229
-
230
-
231
-
232
-
233
-
234
-
235
-
236
-
237
-
238
-
239
-
240
-
241
-
242
-
243
-
244
-
245
-
246
-
247
-
248
-
249
-
250
-
251
-
252
-
253
-
254
-
255
-
256
-
257
-
258
-
259
-
260
-
261
-
262
-
263
-
264
-
265
-
266
-
267
-
268
-
269
-
270
-
271
-
272
-
273
-
274
-
275
-
276
-
277
-
278
-
279
-
280
-
281
-
282
-
283
-
284
 |
 |

Bank of America 2012 175
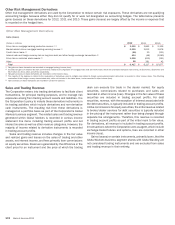
The table below, which includes both derivatives and non-
derivative cash instruments, identifies the amounts in the
respective income statement line items attributable to the
Corporation’s sales and trading revenue in Global Markets,
categorized by primary risk, for 2012, 2011 and 2010. The
difference between total trading account profits in the table below
and in the Corporation’s Consolidated Statement of Income
represents trading activities in business segments other than
Global Markets. Global Markets results in Note 26 – Business
Segment Information are presented on a fully taxable-equivalent
(FTE) basis. The table below is not presented on a FTE basis.
Sales and Trading Revenue
2012
(Dollars in millions)
Trading
Account
Profits
Net
Interest
Income Other (1) Total
Interest rate risk $580 $ 1,040 $ (5) $ 1,615
Foreign exchange risk 909 5 7 921
Equity risk 1,181 (57) 1,890 3,014
Credit risk 2,496 2,321 961 5,778
Other risk 540 (219) (42) 279
Total sales and trading revenue $ 5,706 $ 3,090 $ 2,811 $ 11,607
2011
Interest rate risk $ 2,118 $ 923 $ (63) $ 2,978
Foreign exchange risk 1,088 8 (10) 1,086
Equity risk 1,482 128 2,346 3,956
Credit risk 1,096 2,604 553 4,253
Other risk 633 (184) (72) 377
Total sales and trading revenue $ 6,417 $ 3,479 $ 2,754 $ 12,650
2010
Interest rate risk $ 2,032 $ 659 $ 38 $ 2,729
Foreign exchange risk 903 — (9) 894
Equity risk 1,650 16 2,447 4,113
Credit risk 4,592 3,557 266 8,415
Other risk 447 (172) (4) 271
Total sales and trading revenue $ 9,624 $ 4,060 $ 2,738 $ 16,422
(1) Represents amounts in investment and brokerage services and other income (loss) that are recorded in Global Markets and included in the definition of sales and trading revenue. Includes investment
and brokerage services revenue of $1.8 billion, $2.2 billion and $2.3 billion for 2012, 2011 and 2010, respectively, primarily included in equity risk.
Credit Derivatives
The Corporation enters into credit derivatives primarily to facilitate
client transactions and to manage credit risk exposures. Credit
derivatives derive value based on an underlying third-party
referenced obligation or a portfolio of referenced obligations and
generally require the Corporation, as the seller of credit protection,
to make payments to a buyer upon the occurrence of a pre-defined
credit event. Such credit events generally include bankruptcy of
the referenced credit entity and failure to pay under the obligation,
as well as acceleration of indebtedness and payment repudiation
or moratorium. For credit derivatives based on a portfolio of
referenced credits or credit indices, the Corporation may not be
required to make payment until a specified amount of loss has
occurred and/or may only be required to make payment up to a
specified amount.