Bank of America 2012 Annual Report Download - page 49
Download and view the complete annual report
Please find page 49 of the 2012 Bank of America annual report below. You can navigate through the pages in the report by either clicking on the pages listed below, or by using the keyword search tool below to find specific information within the annual report.-
 1
1 -
2
-
3
-
4
-
5
-
6
-
7
-
8
-
9
-
10
-
11
-
12
-
13
-
14
-
15
-
16
-
17
-
18
-
19
-
20
-
21
-
22
-
23
-
24
-
25
-
26
-
27
-
28
-
29
-
30
-
31
-
32
-
33
-
34
-
35
-
36
-
37
-
38
-
 39
39 -
 40
40 -
 41
41 -
 42
42 -
 43
43 -
 44
44 -
 45
45 -
 46
46 -
 47
47 -
 48
48 -
 49
49 -
 50
50 -
 51
51 -
 52
52 -
 53
53 -
 54
54 -
 55
55 -
 56
56 -
 57
57 -
 58
58 -
 59
59 -
60
-
61
-
62
-
63
-
64
-
65
-
66
-
67
-
68
-
69
-
70
-
71
-
72
-
73
-
74
-
75
-
76
-
77
-
78
-
79
-
80
-
81
-
82
-
83
-
84
-
85
-
86
-
87
-
88
-
89
-
90
-
91
-
92
-
93
-
94
-
95
-
96
-
97
-
98
-
99
-
100
-
101
-
102
-
103
-
104
-
105
-
106
-
107
-
108
-
109
-
110
-
111
-
112
-
113
-
114
-
115
-
116
-
117
-
118
-
119
-
120
-
121
-
122
-
123
-
124
-
125
-
126
-
127
-
128
-
129
-
130
-
131
-
132
-
133
-
134
-
135
-
136
-
137
-
138
-
139
-
140
-
141
-
142
-
143
-
144
-
145
-
146
-
147
-
148
-
149
-
150
-
151
-
152
-
153
-
154
-
155
-
156
-
157
-
158
-
159
-
160
-
161
-
162
-
163
-
164
-
165
-
166
-
167
-
168
-
169
-
170
-
171
-
172
-
173
-
174
-
175
-
176
-
177
-
178
-
179
-
180
-
181
-
182
-
183
-
184
-
185
-
186
-
187
-
188
-
189
-
190
-
191
-
192
-
193
-
194
-
195
-
196
-
197
-
198
-
199
-
200
-
201
-
202
-
203
-
204
-
205
-
206
-
207
-
208
-
209
-
210
-
211
-
212
-
213
-
214
-
215
-
216
-
217
-
218
-
219
-
220
-
221
-
222
-
223
-
224
-
225
-
226
-
227
-
228
-
229
-
230
-
231
-
232
-
233
-
234
-
235
-
236
-
237
-
238
-
239
-
240
-
241
-
242
-
243
-
244
-
245
-
246
-
247
-
248
-
249
-
250
-
251
-
252
-
253
-
254
-
255
-
256
-
257
-
258
-
259
-
260
-
261
-
262
-
263
-
264
-
265
-
266
-
267
-
268
-
269
-
270
-
271
-
272
-
273
-
274
-
275
-
276
-
277
-
278
-
279
-
280
-
281
-
282
-
283
-
284
 |
 |

Bank of America 2012 47
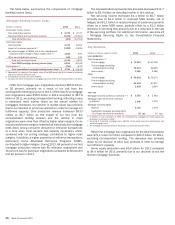
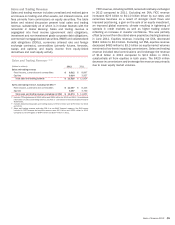
Migration Summary
GWIM results are impacted by the migration of clients and their
related deposit and loan balances to or from CBB, CRES and the
ALM portfolio, as presented in the table below. Migration in 2011
included the movement of balances to Merrill Edge, which is
included in CBB. Subsequent to the date of the migration, the
associated net interest income, noninterest income and
noninterest expense are recorded in the business to which the
clients migrated.
Migration Summary
(Dollars in millions) 2012 2011
Average
Total deposits – GWIM from / (to) CBB $ 407 $ (2,032)
Total loans – GWIM to CRES and the ALM portfolio (225) (174)
Year end
Total deposits – GWIM from / (to) CBB $ 1,170 $ (2,918)
Total loans – GWIM to CRES and the ALM portfolio (335) (299)
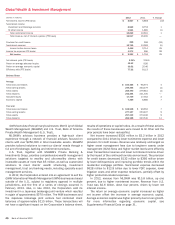
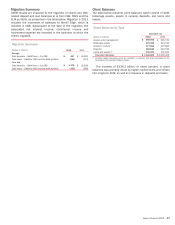
Client Balances
The table below presents client balances which consist of AUM,
brokerage assets, assets in custody, deposits, and loans and
leases.
Client Balances by Type
December 31
(Dollars in millions) 2012 2011
Assets under management $ 698,095 $ 635,570
Brokerage assets 975,388 944,532
Assets in custody 117,686 107,982
Deposits 266,188 240,540
Loans and leases (1) 109,305 101,844
Total client balances $ 2,166,662 $ 2,030,468
(1) Includes margin receivables which are classified in customer and other receivables on the
Corporation’s Consolidated Balance Sheet.
The increase of $136.2 billion, or seven percent, in client
balances was primarily driven by higher market levels and inflows
into long-term AUM, as well as increases in deposits and loans.