Bank of America 2012 Annual Report Download - page 84
Download and view the complete annual report
Please find page 84 of the 2012 Bank of America annual report below. You can navigate through the pages in the report by either clicking on the pages listed below, or by using the keyword search tool below to find specific information within the annual report.-
 1
1 -
2
-
3
-
4
-
5
-
6
-
7
-
8
-
9
-
10
-
11
-
12
-
13
-
14
-
15
-
16
-
17
-
18
-
19
-
20
-
21
-
22
-
23
-
24
-
25
-
26
-
27
-
28
-
29
-
30
-
31
-
32
-
33
-
34
-
35
-
36
-
37
-
38
-
39
-
40
-
41
-
42
-
43
-
44
-
45
-
46
-
47
-
48
-
49
-
50
-
51
-
52
-
53
-
54
-
55
-
56
-
57
-
58
-
59
-
60
-
61
-
62
-
63
-
64
-
65
-
66
-
67
-
68
-
69
-
70
-
71
-
72
-
73
-
 74
74 -
 75
75 -
 76
76 -
 77
77 -
 78
78 -
 79
79 -
 80
80 -
 81
81 -
 82
82 -
 83
83 -
 84
84 -
 85
85 -
 86
86 -
 87
87 -
 88
88 -
 89
89 -
 90
90 -
 91
91 -
 92
92 -
 93
93 -
 94
94 -
95
-
96
-
97
-
98
-
99
-
100
-
101
-
102
-
103
-
104
-
105
-
106
-
107
-
108
-
109
-
110
-
111
-
112
-
113
-
114
-
115
-
116
-
117
-
118
-
119
-
120
-
121
-
122
-
123
-
124
-
125
-
126
-
127
-
128
-
129
-
130
-
131
-
132
-
133
-
134
-
135
-
136
-
137
-
138
-
139
-
140
-
141
-
142
-
143
-
144
-
145
-
146
-
147
-
148
-
149
-
150
-
151
-
152
-
153
-
154
-
155
-
156
-
157
-
158
-
159
-
160
-
161
-
162
-
163
-
164
-
165
-
166
-
167
-
168
-
169
-
170
-
171
-
172
-
173
-
174
-
175
-
176
-
177
-
178
-
179
-
180
-
181
-
182
-
183
-
184
-
185
-
186
-
187
-
188
-
189
-
190
-
191
-
192
-
193
-
194
-
195
-
196
-
197
-
198
-
199
-
200
-
201
-
202
-
203
-
204
-
205
-
206
-
207
-
208
-
209
-
210
-
211
-
212
-
213
-
214
-
215
-
216
-
217
-
218
-
219
-
220
-
221
-
222
-
223
-
224
-
225
-
226
-
227
-
228
-
229
-
230
-
231
-
232
-
233
-
234
-
235
-
236
-
237
-
238
-
239
-
240
-
241
-
242
-
243
-
244
-
245
-
246
-
247
-
248
-
249
-
250
-
251
-
252
-
253
-
254
-
255
-
256
-
257
-
258
-
259
-
260
-
261
-
262
-
263
-
264
-
265
-
266
-
267
-
268
-
269
-
270
-
271
-
272
-
273
-
274
-
275
-
276
-
277
-
278
-
279
-
280
-
281
-
282
-
283
-
284
 |
 |

82 Bank of America 2012
downs on loans greater than 180 days past due which were written
down to the estimated fair value of the collateral less estimated
costs to sell, and favorable delinquency trends. In addition, 2012
included $75 million in net charge-offs related to loans discharged
in Chapter 7 bankruptcy that were written down to the underlying
collateral value as a result of new regulatory guidance. For more
information on the new regulatory guidance on loans discharged
in Chapter 7 bankruptcy, see Consumer Portfolio Credit Risk
Management on page 76 and Table 21. Net charge-off ratios were
further impacted by lower loan balances primarily due to paydowns
and charge-offs outpacing new originations.
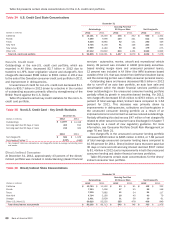
Loans in the residential mortgage portfolio with certain
characteristics have greater risk of loss than others. These
characteristics include loans with a high refreshed LTV, loans
originated at the peak of home prices in 2006 and 2007, interest-
only loans and loans to borrowers located in California and Florida
where we have concentrations and where significant declines in
home prices have been experienced. Although the disclosures in
this section address each of these risk characteristics separately,
there is significant overlap in loans with these characteristics,
which contributed to a disproportionate share of the losses in the
portfolio. The residential mortgage loans with all of these higher
risk characteristics comprised four percent and six percent of the
residential mortgage portfolio at December 31, 2012 and 2011,
and accounted for 20 percent of the residential mortgage net
charge-offs in 2012, and 23 percent in 2011.
Residential mortgage loans with a greater than 90 percent but
less than 100 percent refreshed LTV represented 10 percent and
11 percent of the residential mortgage portfolio at December 31,
2012 and 2011. Loans with a refreshed LTV greater than
100 percent represented 20 percent and 26 percent of the
residential mortgage loan portfolio at December 31, 2012 and
2011. Of the loans with a refreshed LTV greater than 100 percent,
92 percent were performing at both December 31, 2012 and 2011.
Loans with a refreshed LTV greater than 100 percent reflect loans
where the outstanding carrying value of the loan is greater than
the most recent valuation of the property securing the loan. The
majority of these loans have a refreshed LTV greater than 100
percent primarily due to home price deterioration over the past
several years. Loans to borrowers with refreshed FICO scores
below 620 represented 14 percent and 15 percent of the
residential mortgage portfolio at December 31, 2012 and 2011.
Of the $143.6 billion and $158.5 billion in total residential
mortgage loans outstanding at December 31, 2012 and 2011, as
shown in Table 26, 41 percent and 40 percent were originated as
interest-only loans. The outstanding balance of interest-only
residential mortgage loans that have entered the amortization
period was $13.7 billion, or 23 percent, at December 31, 2012.
Residential mortgage loans that have entered the amortization
period have experienced a higher rate of early stage delinquencies
and nonperforming status compared to the residential mortgage
portfolio as a whole. As of December 31, 2012, $368 million, or
three percent of outstanding interest-only residential mortgages
that had entered the amortization period were accruing past due
30 days or more compared to $3.1 billion, or two percent of
accruing past due 30 days or more for the entire residential
mortgage portfolio. In addition, at December 31, 2012, $2.1
billion, or 16 percent of outstanding interest-only residential
mortgages that had entered the amortization period were
nonperforming compared to $14.8 billion, or 10 percent of
nonperforming loans for the entire residential mortgage portfolio.
Loans in our interest-only residential mortgage portfolio have an
interest-only period of three to 10 years and more than 85 percent
of these loans will not be required to make a fully-amortizing
payment until 2015 or later.
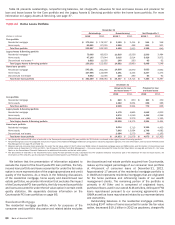
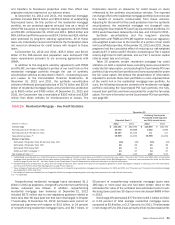
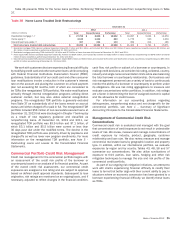
Table 26 presents outstandings, nonperforming loans and net
charge-offs by certain state concentrations for the residential
mortgage portfolio. The Los Angeles-Long Beach-Santa Ana
Metropolitan Statistical Area (MSA) within California represented
12 percent of outstandings at both December 31, 2012 and 2011.
Loans within this MSA comprised only eight percent and seven
percent of net charge-offs for 2012 and 2011.
Table 26 Residential Mortgage State Concentrations
December 31
Outstandings (1) Nonperforming (1) Net Charge-offs
(Dollars in millions) 2012 2011 2012 (2) 2011 2012 (2) 2011
California $ 48,281 $ 54,203 $ 4,510 $ 5,606 $ 1,117 $ 1,326
New York (3) 11,240 11,539 956 838 79 106
Florida (3) 10,994 12,338 1,729 1,900 372 595
Texas 6,885 7,525 488 425 51 55
Virginia 5,067 5,709 404 399 50 64
Other U.S./Non-U.S. 61,123 67,156 6,721 6,802 1,384 1,686
Residential mortgage loans (4) $ 143,590 $158,470 $ 14,808 $ 15,970 $ 3,053 $ 3,832
Fully-insured loan portfolio 90,854 93,854
Countrywide purchased credit-impaired residential mortgage loan portfolio 8,737 9,966
Total residential mortgage loan portfolio $ 243,181 $262,290
(1) Outstandings and nonperforming amounts exclude loans accounted for under the fair value option. There were $147 million and $906 million of residential mortgage loans accounted for under the
fair value option at December 31, 2012 and 2011. See Consumer Portfolio Credit Risk Management – Consumer Loans Accounted for Under the Fair Value Option on page 89 and Note 22 – Fair
Value Option to the Consolidated Financial Statements for additional information on the fair value option.
(2) Nonperforming loans and net charge-offs include the impact of new regulatory guidance on loans discharged in Chapter 7 bankruptcy. For more information, see Consumer Portfolio Credit Risk
Management on page 76 and Table 21.
(3) In these states, foreclosure requires a court order following a legal proceeding (judicial states).
(4) Amount excludes the Countrywide PCI residential mortgage and fully-insured loan portfolios.
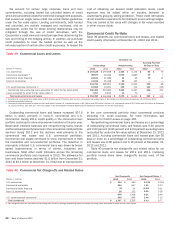
The Community Reinvestment Act (CRA) encourages banks to
meet the credit needs of their communities for housing and other
purposes, particularly in neighborhoods with low or moderate
incomes. At December 31, 2012 and 2011, our CRA portfolio was
$11.3 billion and $12.5 billion, or eight percent of the residential
mortgage loan balances for both periods. The CRA portfolio
included $2.5 billion of nonperforming loans at both December
31, 2012 and 2011 representing 17 percent and 15 percent of