Bank of America 2012 Annual Report Download - page 98
Download and view the complete annual report
Please find page 98 of the 2012 Bank of America annual report below. You can navigate through the pages in the report by either clicking on the pages listed below, or by using the keyword search tool below to find specific information within the annual report.-
 1
1 -
2
-
3
-
4
-
5
-
6
-
7
-
8
-
9
-
10
-
11
-
12
-
13
-
14
-
15
-
16
-
17
-
18
-
19
-
20
-
21
-
22
-
23
-
24
-
25
-
26
-
27
-
28
-
29
-
30
-
31
-
32
-
33
-
34
-
35
-
36
-
37
-
38
-
39
-
40
-
41
-
42
-
43
-
44
-
45
-
46
-
47
-
48
-
49
-
50
-
51
-
52
-
53
-
54
-
55
-
56
-
57
-
58
-
59
-
60
-
61
-
62
-
63
-
64
-
65
-
66
-
67
-
68
-
69
-
70
-
71
-
72
-
73
-
74
-
75
-
76
-
77
-
78
-
79
-
80
-
81
-
82
-
83
-
84
-
85
-
86
-
87
-
 88
88 -
 89
89 -
 90
90 -
 91
91 -
 92
92 -
 93
93 -
 94
94 -
 95
95 -
 96
96 -
 97
97 -
 98
98 -
 99
99 -
 100
100 -
 101
101 -
 102
102 -
 103
103 -
 104
104 -
 105
105 -
 106
106 -
 107
107 -
 108
108 -
109
-
110
-
111
-
112
-
113
-
114
-
115
-
116
-
117
-
118
-
119
-
120
-
121
-
122
-
123
-
124
-
125
-
126
-
127
-
128
-
129
-
130
-
131
-
132
-
133
-
134
-
135
-
136
-
137
-
138
-
139
-
140
-
141
-
142
-
143
-
144
-
145
-
146
-
147
-
148
-
149
-
150
-
151
-
152
-
153
-
154
-
155
-
156
-
157
-
158
-
159
-
160
-
161
-
162
-
163
-
164
-
165
-
166
-
167
-
168
-
169
-
170
-
171
-
172
-
173
-
174
-
175
-
176
-
177
-
178
-
179
-
180
-
181
-
182
-
183
-
184
-
185
-
186
-
187
-
188
-
189
-
190
-
191
-
192
-
193
-
194
-
195
-
196
-
197
-
198
-
199
-
200
-
201
-
202
-
203
-
204
-
205
-
206
-
207
-
208
-
209
-
210
-
211
-
212
-
213
-
214
-
215
-
216
-
217
-
218
-
219
-
220
-
221
-
222
-
223
-
224
-
225
-
226
-
227
-
228
-
229
-
230
-
231
-
232
-
233
-
234
-
235
-
236
-
237
-
238
-
239
-
240
-
241
-
242
-
243
-
244
-
245
-
246
-
247
-
248
-
249
-
250
-
251
-
252
-
253
-
254
-
255
-
256
-
257
-
258
-
259
-
260
-
261
-
262
-
263
-
264
-
265
-
266
-
267
-
268
-
269
-
270
-
271
-
272
-
273
-
274
-
275
-
276
-
277
-
278
-
279
-
280
-
281
-
282
-
283
-
284
 |
 |
96 Bank of America 2012
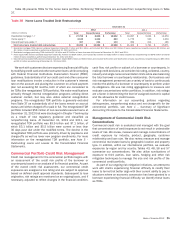
At December 31, 2012 and 2011, the commercial real estate
loan portfolio included $6.7 billion and $10.9 billion of funded
construction and land development loans that were originated to
fund the construction and/or rehabilitation of commercial
properties. The decline in construction and land development
loans was driven by repayments, net charge-offs, continued risk
mitigation initiatives and a reduced emphasis on new originations.
This portfolio is mostly secured and diversified across property
types and geographic regions but faces continuing challenges in
the housing markets. Reservable criticized construction and land
development loans totaled $1.5 billion and $4.9 billion, and
nonperforming construction and land development loans and
foreclosed properties totaled $730 million and $2.1 billion at
December 31, 2012 and 2011. During a property’s construction
phase, interest income is typically paid from interest reserves that
are established at the inception of the loan. As construction is
completed and the property is put into service, these interest
reserves are depleted and interest payments from operating cash
flows begin. Loans generally continue to be classified as
construction loans until operating cash flows reach appropriate
levels or the loans are refinanced. We do not recognize interest
income on nonperforming loans regardless of the existence of an
interest reserve.
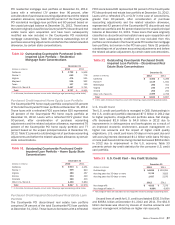
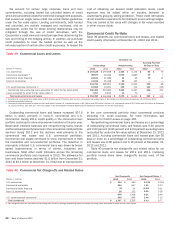
Non-U.S. Commercial
At December 31, 2012, 72 percent of the non-U.S. commercial
loan portfolio was managed in Global Banking and 28 percent in
Global Markets. Outstanding loans, excluding loans accounted for
under the fair value option, increased $18.8 billion in 2012
primarily due to increased client financing activity, structured
lending and trade finance exposures. Net charge-offs decreased
$124 million in 2012 compared to 2011. For additional
information on the non-U.S. commercial portfolio, see Non-U.S.
Portfolio on page 101.
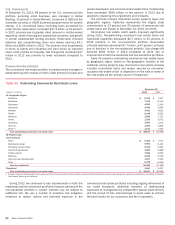
U.S. Small Business Commercial
The U.S. small business commercial loan portfolio is comprised
of small business card and small business loans managed in CBB.
Card-related products were 45 percent and 46 percent of the U.S.
small business commercial portfolio at December 31, 2012 and
2011. U.S. small business commercial net charge-offs decreased
$296 million in 2012 compared to 2011 driven by improvements
in delinquencies, collections and bankruptcies resulting from an
improved economic environment as well as the reduction of higher
risk vintages and the impact of higher credit quality originations.
Of the U.S. small business commercial net charge-offs, 58 percent
were credit card-related products in 2012 compared to 74 percent
in 2011.
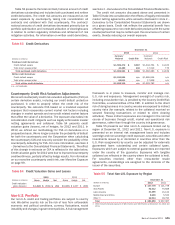
Commercial Loans Accounted for Under the Fair Value
Option
The portfolio of commercial loans accounted for under the fair
value option is managed primarily in Global Banking. Outstanding
commercial loans accounted for under the fair value option
increased $1.4 billion to an aggregate fair value of $8.0 billion at
December 31, 2012 primarily due to increased corporate
borrowings under bank credit facilities. We recorded net gains of
$213 million in 2012 compared to net losses of $174 million in
2011 resulting from changes in the fair value of the loan portfolio.
These amounts were primarily attributable to changes in
instrument-specific credit risk, were recorded in other income
(loss) and do not reflect the results of hedging activities.
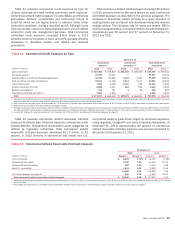
In addition, unfunded lending commitments and letters of credit
accounted for under the fair value option had an aggregate fair
value of $528 million and $1.2 billion at December 31, 2012 and
2011 which was recorded in accrued expenses and other
liabilities. The associated aggregate notional amount of unfunded
lending commitments and letters of credit accounted for under the
fair value option was $18.3 billion and $25.7 billion at
December 31, 2012 and 2011. We recorded net gains of $704
million from changes in the fair value of commitments and letters
of credit during 2012 compared to net losses of $429 million in
2011 resulting from maturities and terminations at par value and
changes in the fair value of the loan portfolio. These amounts were
primarily attributable to changes in instrument-specific credit risk,
were recorded in other income (loss) and do not reflect the results
of hedging activities.