Bank of America 2012 Annual Report Download - page 271
Download and view the complete annual report
Please find page 271 of the 2012 Bank of America annual report below. You can navigate through the pages in the report by either clicking on the pages listed below, or by using the keyword search tool below to find specific information within the annual report.-
 1
1 -
2
-
3
-
4
-
5
-
6
-
7
-
8
-
9
-
10
-
11
-
12
-
13
-
14
-
15
-
16
-
17
-
18
-
19
-
20
-
21
-
22
-
23
-
24
-
25
-
26
-
27
-
28
-
29
-
30
-
31
-
32
-
33
-
34
-
35
-
36
-
37
-
38
-
39
-
40
-
41
-
42
-
43
-
44
-
45
-
46
-
47
-
48
-
49
-
50
-
51
-
52
-
53
-
54
-
55
-
56
-
57
-
58
-
59
-
60
-
61
-
62
-
63
-
64
-
65
-
66
-
67
-
68
-
69
-
70
-
71
-
72
-
73
-
74
-
75
-
76
-
77
-
78
-
79
-
80
-
81
-
82
-
83
-
84
-
85
-
86
-
87
-
88
-
89
-
90
-
91
-
92
-
93
-
94
-
95
-
96
-
97
-
98
-
99
-
100
-
101
-
102
-
103
-
104
-
105
-
106
-
107
-
108
-
109
-
110
-
111
-
112
-
113
-
114
-
115
-
116
-
117
-
118
-
119
-
120
-
121
-
122
-
123
-
124
-
125
-
126
-
127
-
128
-
129
-
130
-
131
-
132
-
133
-
134
-
135
-
136
-
137
-
138
-
139
-
140
-
141
-
142
-
143
-
144
-
145
-
146
-
147
-
148
-
149
-
150
-
151
-
152
-
153
-
154
-
155
-
156
-
157
-
158
-
159
-
160
-
161
-
162
-
163
-
164
-
165
-
166
-
167
-
168
-
169
-
170
-
171
-
172
-
173
-
174
-
175
-
176
-
177
-
178
-
179
-
180
-
181
-
182
-
183
-
184
-
185
-
186
-
187
-
188
-
189
-
190
-
191
-
192
-
193
-
194
-
195
-
196
-
197
-
198
-
199
-
200
-
201
-
202
-
203
-
204
-
205
-
206
-
207
-
208
-
209
-
210
-
211
-
212
-
213
-
214
-
215
-
216
-
217
-
218
-
219
-
220
-
221
-
222
-
223
-
224
-
225
-
226
-
227
-
228
-
229
-
230
-
231
-
232
-
233
-
234
-
235
-
236
-
237
-
238
-
239
-
240
-
241
-
242
-
243
-
244
-
245
-
246
-
247
-
248
-
249
-
250
-
251
-
252
-
253
-
254
-
255
-
256
-
257
-
258
-
259
-
260
-
 261
261 -
 262
262 -
 263
263 -
 264
264 -
 265
265 -
 266
266 -
 267
267 -
 268
268 -
 269
269 -
 270
270 -
 271
271 -
 272
272 -
 273
273 -
 274
274 -
 275
275 -
 276
276 -
 277
277 -
 278
278 -
 279
279 -
 280
280 -
 281
281 -
282
-
283
-
284
 |
 |

Bank of America 2012 269
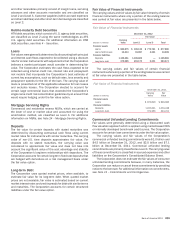
and other receivables primarily consist of margin loans, servicing
advances and other accounts receivable and are classified as
Level 2 and Level 3. Customer payables (within accrued expenses
and other liabilities) and other short-term borrowings are classified
as Level 2.
Held-to-maturity Debt Securities
HTM debt securities, which consist of U.S. agency debt securities,
are classified as Level 2 using the same methodologies as AFS
U.S. agency debt securities. For additional information on HTM
debt securities, see Note 4 – Securities.
Loans
Fair values were generally determined by discounting both principal
and interest cash flows expected to be collected using a discount
rate for similar instruments with adjustments that the Corporation
believes a market participant would consider in determining fair
value. The Corporation estimates the cash flows expected to be
collected using internal credit risk, interest rate and prepayment
risk models that incorporate the Corporation’s best estimate of
current key assumptions, such as default rates, loss severity and
prepayment speeds for the life of the loan. The carrying value of
loans is presented net of the applicable allowance for loan losses
and excludes leases. The Corporation elected to account for
certain large commercial loans that exceeded the Corporation’s
single name credit risk concentration guidelines by an amount that
would require hedging under the fair value option.
Mortgage Servicing Rights
Commercial and residential reverse MSRs, which are carried at
the lower of cost or market value and accounted for using the
amortization method, are classified as Level 3. For additional
information on MSRs, see Note 24 – Mortgage Servicing Rights.
Deposits
The fair value for certain deposits with stated maturities was
determined by discounting contractual cash flows using current
market rates for instruments with similar maturities. The carrying
value of non-U.S. time deposits approximates fair value. For
deposits with no stated maturities, the carrying value was
considered to approximate fair value and does not take into
account the significant value of the cost advantage and stability
of the Corporation’s long-term relationships with depositors. The
Corporation accounts for certain long-term fixed-rate deposits that
are hedged with derivatives on a risk management basis under
the fair value option.
Long-term Debt
The Corporation uses quoted market prices, when available, to
estimate fair value for its long-term debt. When quoted market
prices are not available, fair value is estimated based on current
market interest rates and credit spreads for debt with similar terms
and maturities. The Corporation accounts for certain structured
liabilities under the fair value option.
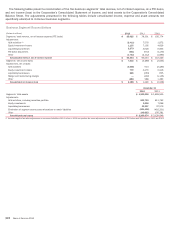
Fair Value of Financial Instruments
The carrying values and fair values by fair value hierarchy of certain
financial instruments where only a portion of the ending balance
was carried at fair value are presented in the table below.
Fair Value of Financial Instruments
December 31, 2012
Fair Value
(Dollars in millions)
Carrying
Value Level 2 Level 3 Total
Financial assets
Loans $ 859,875 $ 105,119 $ 772,761 $ 877,880
Loans held-for-sale 19,413 15,087 4,321 19,408
Financial liabilities
Deposits 1,105,261 1,105,669 — 1,105,669
Long-term debt 275,585 281,173 2,301 283,474
The carrying values and fair values of certain financial
instruments where only a portion of the ending balance was carried
at fair value are presented in the table below.
Fair Value of Financial Instruments
December 31, 2011
(Dollars in millions)
Carrying
Value
Fair
Value
Financial assets
Loans $ 870,520 $ 849,685
Financial liabilities
Deposits 1,033,041 1,033,248
Long-term debt 372,265 343,211
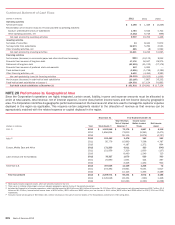
Commercial Unfunded Lending Commitments
Fair values were generally determined using a discounted cash
flow valuation approach which is applied using market-based CDS
or internally developed benchmark credit curves. The Corporation
accounts for certain loan commitments under the fair value option.
The carrying values and fair values of the Corporation’s
commercial unfunded lending commitments were $1.0 billion and
$4.5 billion at December 31, 2012, and $2.0 billion and $7.1
billion at December 31, 2011. Commercial unfunded lending
commitments are primarily classified as Level 3. The carrying value
of these commitments is classified in accrued expenses and other
liabilities on the Corporation’s Consolidated Balance Sheet.
The Corporation does not estimate the fair values of consumer
unfunded lending commitments because, in many instances, the
Corporation can reduce or cancel these commitments by providing
notice to the borrower. For additional information on commitments,
see Note 13 – Commitments and Contingencies.