Bank of America 2012 Annual Report Download - page 27
Download and view the complete annual report
Please find page 27 of the 2012 Bank of America annual report below. You can navigate through the pages in the report by either clicking on the pages listed below, or by using the keyword search tool below to find specific information within the annual report.-
 1
1 -
2
-
3
-
4
-
5
-
6
-
7
-
8
-
9
-
10
-
11
-
12
-
13
-
14
-
15
-
16
-
 17
17 -
 18
18 -
 19
19 -
 20
20 -
 21
21 -
 22
22 -
 23
23 -
 24
24 -
 25
25 -
 26
26 -
 27
27 -
 28
28 -
 29
29 -
 30
30 -
 31
31 -
 32
32 -
 33
33 -
 34
34 -
 35
35 -
 36
36 -
 37
37 -
38
-
39
-
40
-
41
-
42
-
43
-
44
-
45
-
46
-
47
-
48
-
49
-
50
-
51
-
52
-
53
-
54
-
55
-
56
-
57
-
58
-
59
-
60
-
61
-
62
-
63
-
64
-
65
-
66
-
67
-
68
-
69
-
70
-
71
-
72
-
73
-
74
-
75
-
76
-
77
-
78
-
79
-
80
-
81
-
82
-
83
-
84
-
85
-
86
-
87
-
88
-
89
-
90
-
91
-
92
-
93
-
94
-
95
-
96
-
97
-
98
-
99
-
100
-
101
-
102
-
103
-
104
-
105
-
106
-
107
-
108
-
109
-
110
-
111
-
112
-
113
-
114
-
115
-
116
-
117
-
118
-
119
-
120
-
121
-
122
-
123
-
124
-
125
-
126
-
127
-
128
-
129
-
130
-
131
-
132
-
133
-
134
-
135
-
136
-
137
-
138
-
139
-
140
-
141
-
142
-
143
-
144
-
145
-
146
-
147
-
148
-
149
-
150
-
151
-
152
-
153
-
154
-
155
-
156
-
157
-
158
-
159
-
160
-
161
-
162
-
163
-
164
-
165
-
166
-
167
-
168
-
169
-
170
-
171
-
172
-
173
-
174
-
175
-
176
-
177
-
178
-
179
-
180
-
181
-
182
-
183
-
184
-
185
-
186
-
187
-
188
-
189
-
190
-
191
-
192
-
193
-
194
-
195
-
196
-
197
-
198
-
199
-
200
-
201
-
202
-
203
-
204
-
205
-
206
-
207
-
208
-
209
-
210
-
211
-
212
-
213
-
214
-
215
-
216
-
217
-
218
-
219
-
220
-
221
-
222
-
223
-
224
-
225
-
226
-
227
-
228
-
229
-
230
-
231
-
232
-
233
-
234
-
235
-
236
-
237
-
238
-
239
-
240
-
241
-
242
-
243
-
244
-
245
-
246
-
247
-
248
-
249
-
250
-
251
-
252
-
253
-
254
-
255
-
256
-
257
-
258
-
259
-
260
-
261
-
262
-
263
-
264
-
265
-
266
-
267
-
268
-
269
-
270
-
271
-
272
-
273
-
274
-
275
-
276
-
277
-
278
-
279
-
280
-
281
-
282
-
283
-
284
 |
 |

Bank of America 2012 25
Income Tax Benefit
The income tax benefit was $1.1 billion on pre-tax income of $3.1
billion for 2012 compared to an income tax benefit of $1.7 billion
on the pre-tax loss of $230 million for 2011.
Included in the income tax benefit for 2012 was a $1.7 billion
tax benefit attributable to the excess of foreign tax credits
recognized in the U.S. upon repatriation of the earnings of certain
subsidiaries over the related U.S. tax liability. Also included in the
income tax benefit was a $788 million charge to reduce the carrying
value of certain U.K. deferred tax assets due to the two percent
U.K. corporate income tax rate reduction enacted in 2012. Our
effective tax rate for 2012 excluding these two items was a benefit
of seven percent and differed from the statutory rate due to the
impact of our recurring tax preference items (e.g., affordable
housing credits and tax-exempt income) on the level of pre-tax
earnings.
The income tax benefit for 2011 was driven by our recurring
tax preference items, a $1.0 billion benefit from the release of the
remaining valuation allowance applicable to the Merrill Lynch &
Co., Inc. (Merrill Lynch) capital loss carryover deferred tax asset
and a benefit of $823 million for planned realization of previously
unrecognized deferred tax assets related to the tax basis in certain
subsidiaries. These benefits were partially offset by a $782 million
charge for the two percent U.K. corporate income tax rate reduction
enacted in 2011. The $3.2 billion of goodwill impairment charges
recorded during 2011 were non-deductible.
On July 17, 2012, the U.K. 2012 Finance Bill was enacted,
which reduced the U.K. corporate income tax rate by two percent
to 23 percent. The first one percent reduction was effective April
1, 2012 and the second will be effective April 1, 2013. These
reductions favorably affect income tax expense on future U.K.
earnings, but also required us to remeasure our U.K. net deferred
tax assets using the lower tax rates. If the corporate income tax
rate were to be reduced to 21 percent by 2014 as suggested in
U.K. Treasury announcements and assuming no change in the
deferred tax asset balance, we would record a charge to income
tax expense of approximately $800 million in the period of
enactment, which we expect to be in 2013.
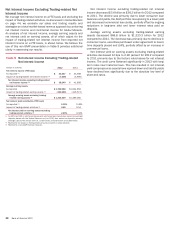
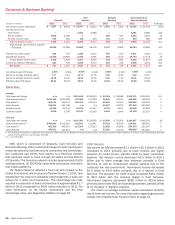
Balance Sheet Overview
Table 5 Selected Balance Sheet Data
December 31 Average Balance
(Dollars in millions) 2012 2011 2012 2011
Assets
Federal funds sold and securities borrowed or purchased under agreements to resell $ 219,924 $211,183 $ 236,042 $ 245,069
Trading account assets 237,226 169,319 182,359 187,340
Debt securities 336,387 311,416 337,653 337,120
Loans and leases 907,819 926,200 898,768 938,096
Allowance for loan and lease losses (24,179) (33,783) (29,843) (37,623)
All other assets 532,797 544,711 566,377 626,320
Total assets $ 2,209,974 $ 2,129,046 $2,191,356 $ 2,296,322
Liabilities
Deposits $ 1,105,261 $ 1,033,041 $1,047,782 $ 1,035,802
Federal funds purchased and securities loaned or sold under agreements to repurchase 293,259 214,864 281,899 272,375
Trading account liabilities 73,587 60,508 78,554 84,689
Commercial paper and other short-term borrowings 30,731 35,698 36,501 51,894
Long-term debt 275,585 372,265 316,393 421,229
All other liabilities 194,595 182,569 194,550 201,238
Total liabilities 1,973,018 1,898,945 1,955,679 2,067,227
Shareholders’ equity 236,956 230,101 235,677 229,095
Total liabilities and shareholders’ equity $ 2,209,974 $ 2,129,046 $2,191,356 $ 2,296,322
At December 31, 2012, total assets were $2.2 trillion, an
increase of $80.9 billion, or four percent, from December 31,
2011. Average total assets decreased $105.0 billion, or five
percent, in 2012 compared to 2011. At December 31, 2012, total
liabilities were $2.0 trillion, an increase of $74.1 billion, or four
percent, from December 31, 2011. Average total liabilities
decreased $111.5 billion, or five percent, in 2012 compared to
2011.
Year-end balance sheet amounts may vary from average
balance sheet amounts due to liquidity and balance sheet
management activities, primarily involving our portfolios of highly
liquid assets, that are designed to ensure the adequacy of capital
while enhancing our ability to manage liquidity requirements for
the Corporation and for our customers, and to position the balance
sheet in accordance with the Corporation’s risk appetite. The
execution of these activities requires the use of balance sheet
and capital-related limits including spot, average and risk-weighted
asset limits, particularly within the market-making activities of our
trading businesses. One of our key regulatory metrics, Tier 1
leverage ratio, is calculated based on adjusted quarterly average
total assets.