Bank of America 2012 Annual Report Download - page 171
Download and view the complete annual report
Please find page 171 of the 2012 Bank of America annual report below. You can navigate through the pages in the report by either clicking on the pages listed below, or by using the keyword search tool below to find specific information within the annual report.-
 1
1 -
2
-
3
-
4
-
5
-
6
-
7
-
8
-
9
-
10
-
11
-
12
-
13
-
14
-
15
-
16
-
17
-
18
-
19
-
20
-
21
-
22
-
23
-
24
-
25
-
26
-
27
-
28
-
29
-
30
-
31
-
32
-
33
-
34
-
35
-
36
-
37
-
38
-
39
-
40
-
41
-
42
-
43
-
44
-
45
-
46
-
47
-
48
-
49
-
50
-
51
-
52
-
53
-
54
-
55
-
56
-
57
-
58
-
59
-
60
-
61
-
62
-
63
-
64
-
65
-
66
-
67
-
68
-
69
-
70
-
71
-
72
-
73
-
74
-
75
-
76
-
77
-
78
-
79
-
80
-
81
-
82
-
83
-
84
-
85
-
86
-
87
-
88
-
89
-
90
-
91
-
92
-
93
-
94
-
95
-
96
-
97
-
98
-
99
-
100
-
101
-
102
-
103
-
104
-
105
-
106
-
107
-
108
-
109
-
110
-
111
-
112
-
113
-
114
-
115
-
116
-
117
-
118
-
119
-
120
-
121
-
122
-
123
-
124
-
125
-
126
-
127
-
128
-
129
-
130
-
131
-
132
-
133
-
134
-
135
-
136
-
137
-
138
-
139
-
140
-
141
-
142
-
143
-
144
-
145
-
146
-
147
-
148
-
149
-
150
-
151
-
152
-
153
-
154
-
155
-
156
-
157
-
158
-
159
-
160
-
 161
161 -
 162
162 -
 163
163 -
 164
164 -
 165
165 -
 166
166 -
 167
167 -
 168
168 -
 169
169 -
 170
170 -
 171
171 -
 172
172 -
 173
173 -
 174
174 -
 175
175 -
 176
176 -
 177
177 -
 178
178 -
 179
179 -
 180
180 -
 181
181 -
182
-
183
-
184
-
185
-
186
-
187
-
188
-
189
-
190
-
191
-
192
-
193
-
194
-
195
-
196
-
197
-
198
-
199
-
200
-
201
-
202
-
203
-
204
-
205
-
206
-
207
-
208
-
209
-
210
-
211
-
212
-
213
-
214
-
215
-
216
-
217
-
218
-
219
-
220
-
221
-
222
-
223
-
224
-
225
-
226
-
227
-
228
-
229
-
230
-
231
-
232
-
233
-
234
-
235
-
236
-
237
-
238
-
239
-
240
-
241
-
242
-
243
-
244
-
245
-
246
-
247
-
248
-
249
-
250
-
251
-
252
-
253
-
254
-
255
-
256
-
257
-
258
-
259
-
260
-
261
-
262
-
263
-
264
-
265
-
266
-
267
-
268
-
269
-
270
-
271
-
272
-
273
-
274
-
275
-
276
-
277
-
278
-
279
-
280
-
281
-
282
-
283
-
284
 |
 |

Bank of America 2012 169
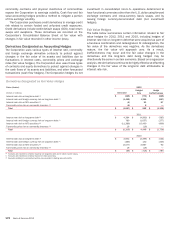
Insurance Income and Insurance Expense
Property and casualty and credit life and disability premiums are
generally recognized over the term of the policies on a pro-rata
basis for all policies except for certain of the lender-placed auto
insurance and the guaranteed auto protection (GAP) policies. For
lender-placed auto insurance, premiums are recognized when
collections become probable due to high cancellation rates
experienced early in the life of the policy. For GAP insurance,
revenue recognition is correlated to the exposure and accelerated
over the life of the contract. Mortgage reinsurance premiums are
recognized as earned. Insurance expense includes insurance
claims, commissions and premium taxes, all of which are recorded
in other general operating expense.
Accounting Policies
All significant accounting policies are discussed either in this Note
or included in the Notes herein listed below.
Page
Note 3 – Derivatives
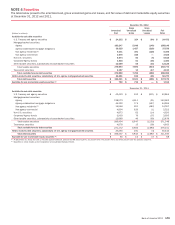
Note 4 – Securities
Note 5 – Outstanding Loans and Leases
Note 7 – Securitizations and Other Variable Interest
Entities
Note 8 – Representations and Warranties Obligations
and Corporate Guarantees
Note 13 – Commitments and Contingencies
Note 18 – Employee Benefit Plans
Note 19 – Stock-based Compensation Plans
Note 20 – Income Taxes
Note 21 – Fair Value Measurements
Note 24 – Mortgage Servicing Rights
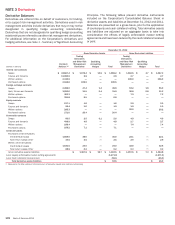
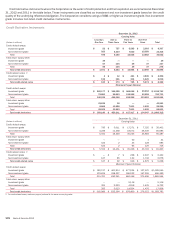
NOTE 2 Trading Account Assets and Liabilities
The table below presents the components of trading account assets and liabilities at December 31, 2012 and 2011.
December 31
(Dollars in millions) 2012 2011
Trading account assets
U.S. government and agency securities (1) $86,974 $ 52,613
Corporate securities, trading loans and other 37,900 36,571
Equity securities 43,315 23,674
Non-U.S. sovereign debt 52,197 42,946
Mortgage trading loans and asset-backed securities 16,840 13,515
Total trading account assets $ 237,226 $ 169,319
Trading account liabilities
U.S. government and agency securities $23,430 $ 20,710
Equity securities 22,492 14,594
Non-U.S. sovereign debt 20,244 17,440
Corporate securities and other 7,421 7,764
Total trading account liabilities $ 73,587 $ 60,508
(1) Includes $30.6 billion and $27.3 billion of government-sponsored enterprise obligations at December 31, 2012 and 2011.
170
179
184
200
207
223
241
249
251
253
270