Bank of America 2012 Annual Report Download - page 240
Download and view the complete annual report
Please find page 240 of the 2012 Bank of America annual report below. You can navigate through the pages in the report by either clicking on the pages listed below, or by using the keyword search tool below to find specific information within the annual report.-
 1
1 -
2
-
3
-
4
-
5
-
6
-
7
-
8
-
9
-
10
-
11
-
12
-
13
-
14
-
15
-
16
-
17
-
18
-
19
-
20
-
21
-
22
-
23
-
24
-
25
-
26
-
27
-
28
-
29
-
30
-
31
-
32
-
33
-
34
-
35
-
36
-
37
-
38
-
39
-
40
-
41
-
42
-
43
-
44
-
45
-
46
-
47
-
48
-
49
-
50
-
51
-
52
-
53
-
54
-
55
-
56
-
57
-
58
-
59
-
60
-
61
-
62
-
63
-
64
-
65
-
66
-
67
-
68
-
69
-
70
-
71
-
72
-
73
-
74
-
75
-
76
-
77
-
78
-
79
-
80
-
81
-
82
-
83
-
84
-
85
-
86
-
87
-
88
-
89
-
90
-
91
-
92
-
93
-
94
-
95
-
96
-
97
-
98
-
99
-
100
-
101
-
102
-
103
-
104
-
105
-
106
-
107
-
108
-
109
-
110
-
111
-
112
-
113
-
114
-
115
-
116
-
117
-
118
-
119
-
120
-
121
-
122
-
123
-
124
-
125
-
126
-
127
-
128
-
129
-
130
-
131
-
132
-
133
-
134
-
135
-
136
-
137
-
138
-
139
-
140
-
141
-
142
-
143
-
144
-
145
-
146
-
147
-
148
-
149
-
150
-
151
-
152
-
153
-
154
-
155
-
156
-
157
-
158
-
159
-
160
-
161
-
162
-
163
-
164
-
165
-
166
-
167
-
168
-
169
-
170
-
171
-
172
-
173
-
174
-
175
-
176
-
177
-
178
-
179
-
180
-
181
-
182
-
183
-
184
-
185
-
186
-
187
-
188
-
189
-
190
-
191
-
192
-
193
-
194
-
195
-
196
-
197
-
198
-
199
-
200
-
201
-
202
-
203
-
204
-
205
-
206
-
207
-
208
-
209
-
210
-
211
-
212
-
213
-
214
-
215
-
216
-
217
-
218
-
219
-
220
-
221
-
222
-
223
-
224
-
225
-
226
-
227
-
228
-
229
-
 230
230 -
 231
231 -
 232
232 -
 233
233 -
 234
234 -
 235
235 -
 236
236 -
 237
237 -
 238
238 -
 239
239 -
 240
240 -
 241
241 -
 242
242 -
 243
243 -
 244
244 -
 245
245 -
 246
246 -
 247
247 -
 248
248 -
 249
249 -
 250
250 -
251
-
252
-
253
-
254
-
255
-
256
-
257
-
258
-
259
-
260
-
261
-
262
-
263
-
264
-
265
-
266
-
267
-
268
-
269
-
270
-
271
-
272
-
273
-
274
-
275
-
276
-
277
-
278
-
279
-
280
-
281
-
282
-
283
-
284
 |
 |

238 Bank of America 2012
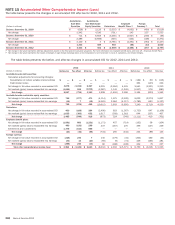
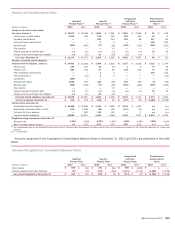
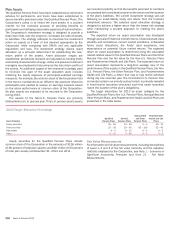
NOTE 15 Accumulated Other Comprehensive Income (Loss)
The table below presents the changes in accumulated OCI after-tax for 2010, 2011 and 2012.
(Dollars in millions)
Available-for-
Sale Debt
Securities
Available-for-
Sale Marketable
Equity Securities Derivatives
Employee
Benefit Plans (1)
Foreign
Currency (2) Total
Balance, December 31, 2009 $ (628) $ 2,129 $ (2,535) $ (4,092) $ (493) $ (5,619)
Net change 1,342 4,530 (701) 145 237 5,553
Balance, December 31, 2010 $ 714 $ 6,659 $ (3,236) $ (3,947) $ (256) $ (66)
Net change 2,386 (6,656) (549) (444) (108) (5,371)
Balance, December 31, 2011 $ 3,100 $ 3 $ (3,785) $ (4,391) $ (364) $ (5,437)
Net change 1,343 459 916 (65) (13) 2,640
Balance, December 31, 2012 $ 4,443 $ 462 $(2,869)$ (4,456)$ (377) $ (2,797)
(1) Net change in fair value represents after-tax adjustments based on the final year-end actuarial valuations. For more information on employee benefit plans, see Note 18 – Employee Benefit Plans.
(2) Net change in fair value represents the impact of changes in spot foreign exchange rates on the Corporation’s net investment in non-U.S. operations, and related hedges.
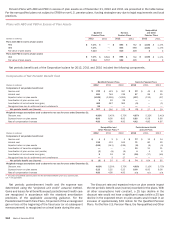
The table below presents the before- and after-tax changes in accumulated OCI for 2012, 2011 and 2010.
2012 2011 2010
(Dollars in millions) Before-tax Tax effect After-tax Before-tax Tax effect After-tax Before-tax Tax effect After-tax
Available-for-sale debt securities:
Cumulative adjustments for accounting changes:
Consolidation of certain variable interest entities $ —$ —$ —$ — $ — $ — $ (184) $ 68 $ (116)
Credit-related notes — —— — — — 364 (135) 229
Net change in fair value recorded in accumulated OCI 3,676 (1,319) 2,357 6,925 (2,594) 4,331 3,541 (1,331) 2,210
Net realized (gains) losses reclassified into earnings (1,609) 595 (1,014)(3,087) 1,142 (1,945) (1,557) 576 (981)
Net change 2,067 (724) 1,343 3,838 (1,452) 2,386 2,164 (822) 1,342
Available-for-sale marketable equity securities:
Net change in fair value recorded in accumulated OCI 748 (277) 471 (4,114) 1,575 (2,539) 9,029 (3,372) 5,657
Net realized (gains) losses reclassified into earnings (19) 7 (12) (6,501) 2,384 (4,117) (1,789) 662 (1,127)
Net change 729 (270) 459 (10,615) 3,959 (6,656) 7,240 (2,710) 4,530
Derivatives:
Net change in fair value recorded in accumulated OCI 430 (166) 264 (2,490) 923 (1,567) (1,755) 647 (1,108)
Net realized (gains) losses reclassified into earnings 1,035 (383) 652 1,617 (599) 1,018 644 (237) 407
Net change 1,465 (549) 916 (873) 324 (549) (1,111) 410 (701)
Employee benefit plans:
Net change in fair value recorded in accumulated OCI (1,891) 660 (1,231)(1,171) 457 (714) (162) 58 (104)
Net realized (gains) losses reclassified into earnings 490 (192) 298 437 (167) 270 396 (147) 249
Settlements and curtailments 1,378 (510) 868 — —— — ——
Net change (23) (42) (65) (734) 290 (444) 234 (89) 145
Foreign currency:
Net change in fair value recorded in accumulated OCI (226) 233 7 145 (179) (34) (204) 160 (44)
Net realized (gains) losses reclassified into earnings (30) 10 (20) (65) (9) (74) 446 (165) 281
Net change (256) 243 (13) 80 (188) (108) 242 (5) 237
Total other comprehensive income (loss) $ 3,982 $ (1,342) $ 2,640 $ (8,304) $ 2,933 $ (5,371) $ 8,769 $ (3,216) $ 5,553