Bank of America 2012 Annual Report Download - page 23
Download and view the complete annual report
Please find page 23 of the 2012 Bank of America annual report below. You can navigate through the pages in the report by either clicking on the pages listed below, or by using the keyword search tool below to find specific information within the annual report.-
 1
1 -
2
-
3
-
4
-
5
-
6
-
7
-
8
-
9
-
10
-
11
-
12
-
 13
13 -
 14
14 -
 15
15 -
 16
16 -
 17
17 -
 18
18 -
 19
19 -
 20
20 -
 21
21 -
 22
22 -
 23
23 -
 24
24 -
 25
25 -
 26
26 -
 27
27 -
 28
28 -
 29
29 -
 30
30 -
 31
31 -
 32
32 -
 33
33 -
34
-
35
-
36
-
37
-
38
-
39
-
40
-
41
-
42
-
43
-
44
-
45
-
46
-
47
-
48
-
49
-
50
-
51
-
52
-
53
-
54
-
55
-
56
-
57
-
58
-
59
-
60
-
61
-
62
-
63
-
64
-
65
-
66
-
67
-
68
-
69
-
70
-
71
-
72
-
73
-
74
-
75
-
76
-
77
-
78
-
79
-
80
-
81
-
82
-
83
-
84
-
85
-
86
-
87
-
88
-
89
-
90
-
91
-
92
-
93
-
94
-
95
-
96
-
97
-
98
-
99
-
100
-
101
-
102
-
103
-
104
-
105
-
106
-
107
-
108
-
109
-
110
-
111
-
112
-
113
-
114
-
115
-
116
-
117
-
118
-
119
-
120
-
121
-
122
-
123
-
124
-
125
-
126
-
127
-
128
-
129
-
130
-
131
-
132
-
133
-
134
-
135
-
136
-
137
-
138
-
139
-
140
-
141
-
142
-
143
-
144
-
145
-
146
-
147
-
148
-
149
-
150
-
151
-
152
-
153
-
154
-
155
-
156
-
157
-
158
-
159
-
160
-
161
-
162
-
163
-
164
-
165
-
166
-
167
-
168
-
169
-
170
-
171
-
172
-
173
-
174
-
175
-
176
-
177
-
178
-
179
-
180
-
181
-
182
-
183
-
184
-
185
-
186
-
187
-
188
-
189
-
190
-
191
-
192
-
193
-
194
-
195
-
196
-
197
-
198
-
199
-
200
-
201
-
202
-
203
-
204
-
205
-
206
-
207
-
208
-
209
-
210
-
211
-
212
-
213
-
214
-
215
-
216
-
217
-
218
-
219
-
220
-
221
-
222
-
223
-
224
-
225
-
226
-
227
-
228
-
229
-
230
-
231
-
232
-
233
-
234
-
235
-
236
-
237
-
238
-
239
-
240
-
241
-
242
-
243
-
244
-
245
-
246
-
247
-
248
-
249
-
250
-
251
-
252
-
253
-
254
-
255
-
256
-
257
-
258
-
259
-
260
-
261
-
262
-
263
-
264
-
265
-
266
-
267
-
268
-
269
-
270
-
271
-
272
-
273
-
274
-
275
-
276
-
277
-
278
-
279
-
280
-
281
-
282
-
283
-
284
 |
 |

Bank of America 2012 21
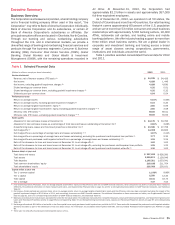
Executive Summary
Business Overview
The Corporation is a Delaware corporation, a bank holding company
and a financial holding company. When used in this report, “the
Corporation” may refer to Bank of America Corporation individually,
Bank of America Corporation and its subsidiaries, or certain of
Bank of America Corporation’s subsidiaries or affiliates. Our
principal executive offices are located in Charlotte, North Carolina.
Through our banking and various nonbanking subsidiaries
throughout the U.S. and in international markets, we provide a
diversified range of banking and nonbanking financial services and
products through five business segments: Consumer & Business
Banking (CBB), Consumer Real Estate Services (CRES), Global
Banking, Global Markets and Global Wealth & Investment
Management (GWIM), with the remaining operations recorded in
All Other. At December 31, 2012, the Corporation had
approximately $2.2 trillion in assets and approximately 267,000
full-time equivalent employees.
As of December 31, 2012, we operated in all 50 states, the
District of Columbia and more than 40 countries. Our retail banking
footprint covers approximately 80 percent of the U.S. population
and we serve more than 53 million consumer and small business
relationships with approximately 5,500 banking centers, 16,300
ATMs, nationwide call centers, and leading online and mobile
banking platforms. We offer industry-leading support to more than
three million small business owners. We are a global leader in
corporate and investment banking and trading across a broad
range of asset classes serving corporations, governments,
institutions and individuals around the world.
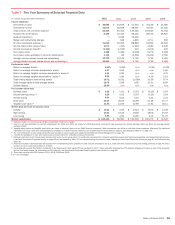
Table 1 provides selected consolidated financial data for 2012
and 2011.
Table 1 Selected Financial Data
(Dollars in millions, except per share information) 2012 2011
Income statement
Revenue, net of interest expense (FTE basis) (1) $84,235 $ 94,426
Net income 4,188 1,446
Net income, excluding goodwill impairment charges (2) 4,188 4,630
Diluted earnings per common share 0.25 0.01
Diluted earnings per common share, excluding goodwill impairment charges (2) 0.25 0.32
Dividends paid per common share 0.04 0.04
Performance ratios
Return on average assets 0.19%0.06%
Return on average assets, excluding goodwill impairment charges (2) 0.19 0.20
Return on average tangible shareholders’ equity (1) 2.60 0.96
Return on average tangible shareholders’ equity, excluding goodwill impairment charges (1, 2) 2.60 3.08
Efficiency ratio (FTE basis) (1) 85.59 85.01
Efficiency ratio (FTE basis), excluding goodwill impairment charges (1, 2) 85.59 81.64
Asset quality
Allowance for loan and lease losses at December 31 $24,179 $ 33,783
Allowance for loan and lease losses as a percentage of total loans and leases outstanding at December 31 (3) 2.69%3.68%
Nonperforming loans, leases and foreclosed properties at December 31 (3) $23,555 $ 27,708
Net charge-offs (4) 14,908 20,833
Net charge-offs as a percentage of average loans and leases outstanding (3, 4) 1.67%2.24%
Net charge-offs as a percentage of average loans and leases outstanding, excluding the purchased credit-impaired loan portfolio (3) 1.73 2.32
Net charge-offs and purchased credit-impaired write-offs as a percentage of average loans and leases outstanding (3, 5) 1.99 2.24
Ratio of the allowance for loan and lease losses at December 31 to net charge-offs (4) 1.62 1.62
Ratio of the allowance for loan and lease losses at December 31 to net charge-offs, excluding the purchased credit-impaired loan portfolio 1.25 1.22
Ratio of the allowance for loan and lease losses at December 31 to net charge-offs and purchased credit-impaired write-offs (5) 1.36 1.62
Balance sheet at year end
Total loans and leases $ 907,819 $ 926,200
Total assets 2,209,974 2,129,046
Total deposits 1,105,261 1,033,041
Total common shareholders’ equity 218,188 211,704
Total shareholders’ equity 236,956 230,101
Capital ratios at year end
Tier 1 common capital 11.06% 9.86%
Tier 1 capital 12.89 12.40
Total capital 16.31 16.75
Tier 1 leverage 7.37 7.53
(1) Fully taxable-equivalent (FTE) basis, return on average tangible shareholders’ equity and the efficiency ratio are non-GAAP financial measures. Other companies may define or calculate these measures
differently. For additional information on these measures and ratios, see Supplemental Financial Data on page 31, and for a corresponding reconciliation to GAAP financial measures, see Statistical
Table XV.
(2) Net income, diluted earnings per common share, return on average assets, return on average tangible shareholders’ equity and the efficiency ratio have been calculated excluding the impact of the
goodwill impairment charges of $3.2 billion in 2011, and accordingly, these are non-GAAP financial measures. For additional information on these measures and ratios, see Supplemental Financial
Data on page 31, and for a corresponding reconciliation to GAAP financial measures, see Statistical Table XV.
(3) Balances and ratios do not include loans accounted for under the fair value option. For additional exclusions from nonperforming loans, leases and foreclosed properties, see Nonperforming Consumer
Loans and Foreclosed Properties Activity on page 89 and corresponding Table 37, and Nonperforming Commercial Loans, Leases and Foreclosed Properties Activity on page 97 and corresponding
Table 46.
(4) Net charge-offs exclude $2.8 billion of write-offs in the Countrywide home equity purchased credit-impaired loan portfolio for 2012. These write-offs decreased the purchased credit-impaired valuation
allowance included as part of the allowance for loan and lease losses. For information on purchased credit-impaired write-offs, see Countrywide Purchased Credit-impaired Loan Portfolio on page
86.
(5) There were no write-offs of purchased credit-impaired loans in 2011.