Bank of America 2012 Annual Report Download - page 184
Download and view the complete annual report
Please find page 184 of the 2012 Bank of America annual report below. You can navigate through the pages in the report by either clicking on the pages listed below, or by using the keyword search tool below to find specific information within the annual report.-
 1
1 -
2
-
3
-
4
-
5
-
6
-
7
-
8
-
9
-
10
-
11
-
12
-
13
-
14
-
15
-
16
-
17
-
18
-
19
-
20
-
21
-
22
-
23
-
24
-
25
-
26
-
27
-
28
-
29
-
30
-
31
-
32
-
33
-
34
-
35
-
36
-
37
-
38
-
39
-
40
-
41
-
42
-
43
-
44
-
45
-
46
-
47
-
48
-
49
-
50
-
51
-
52
-
53
-
54
-
55
-
56
-
57
-
58
-
59
-
60
-
61
-
62
-
63
-
64
-
65
-
66
-
67
-
68
-
69
-
70
-
71
-
72
-
73
-
74
-
75
-
76
-
77
-
78
-
79
-
80
-
81
-
82
-
83
-
84
-
85
-
86
-
87
-
88
-
89
-
90
-
91
-
92
-
93
-
94
-
95
-
96
-
97
-
98
-
99
-
100
-
101
-
102
-
103
-
104
-
105
-
106
-
107
-
108
-
109
-
110
-
111
-
112
-
113
-
114
-
115
-
116
-
117
-
118
-
119
-
120
-
121
-
122
-
123
-
124
-
125
-
126
-
127
-
128
-
129
-
130
-
131
-
132
-
133
-
134
-
135
-
136
-
137
-
138
-
139
-
140
-
141
-
142
-
143
-
144
-
145
-
146
-
147
-
148
-
149
-
150
-
151
-
152
-
153
-
154
-
155
-
156
-
157
-
158
-
159
-
160
-
161
-
162
-
163
-
164
-
165
-
166
-
167
-
168
-
169
-
170
-
171
-
172
-
173
-
 174
174 -
 175
175 -
 176
176 -
 177
177 -
 178
178 -
 179
179 -
 180
180 -
 181
181 -
 182
182 -
 183
183 -
 184
184 -
 185
185 -
 186
186 -
 187
187 -
 188
188 -
 189
189 -
 190
190 -
 191
191 -
 192
192 -
 193
193 -
 194
194 -
195
-
196
-
197
-
198
-
199
-
200
-
201
-
202
-
203
-
204
-
205
-
206
-
207
-
208
-
209
-
210
-
211
-
212
-
213
-
214
-
215
-
216
-
217
-
218
-
219
-
220
-
221
-
222
-
223
-
224
-
225
-
226
-
227
-
228
-
229
-
230
-
231
-
232
-
233
-
234
-
235
-
236
-
237
-
238
-
239
-
240
-
241
-
242
-
243
-
244
-
245
-
246
-
247
-
248
-
249
-
250
-
251
-
252
-
253
-
254
-
255
-
256
-
257
-
258
-
259
-
260
-
261
-
262
-
263
-
264
-
265
-
266
-
267
-
268
-
269
-
270
-
271
-
272
-
273
-
274
-
275
-
276
-
277
-
278
-
279
-
280
-
281
-
282
-
283
-
284
 |
 |

182 Bank of America 2012
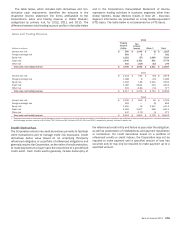
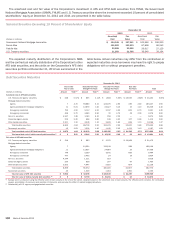
The amortized cost and fair value of the Corporation’s investment in AFS and HTM debt securities from FNMA, the Government
National Mortgage Association (GNMA), FHLMC and U.S. Treasury securities where the investment exceeded 10 percent of consolidated
shareholders’ equity at December 31, 2012 and 2011 are presented in the table below.
Selected Securities Exceeding 10 Percent of Shareholders’ Equity
December 31
2012 2011
(Dollars in millions)
Amortized
Cost
Fair
Value
Amortized
Cost
Fair
Value
Government National Mortgage Association $ 124,348 $ 127,541 $102,960 $ 106,200
Fannie Mae 121,522 123,933 87,898 89,243
Freddie Mac 22,995 23,502 26,617 27,129
U.S. Treasury securities 21,269 21,305 39,946 39,164
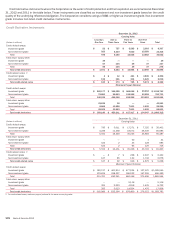
The expected maturity distribution of the Corporation’s MBS
and the contractual maturity distribution of the Corporation’s other
AFS debt securities, and the yields on the Corporation’s AFS debt
securities portfolio at December 31, 2012 are summarized in the
table below. Actual maturities may differ from the contractual or
expected maturities since borrowers may have the right to prepay
obligations with or without prepayment penalties.
Debt Securities Maturities
December 31, 2012
Due in One
Year or Less
Due after One Year
through Five Years
Due after Five Years
through Ten Years
Due after
Ten Years Total
(Dollars in millions) Amount Yield (1) Amount Yield (1) Amount Yield (1) Amount Yield (1) Amount Yield (1)
Amortized cost of AFS debt securities
U.S. Treasury and agency securities $ 548 0.57% $ 855 2.12% $ 1,884 5.30% $ 20,945 2.80% $ 24,232 3.00%
Mortgage-backed securities:
Agency 7 4.70 59,880 3.10 123,075 2.90 285 2.60 183,247 2.90
Agency-collateralized mortgage obligations 11 6.31 12,876 1.20 23,427 3.10 15 1.10 36,329 2.40
Non-agency residential 750 4.50 5,112 4.30 2,767 4.00 602 6.70 9,231 4.40
Non-agency commercial 456 5.70 3,080 5.90 22 3.70 18 4.03 3,576 5.90
Non-U.S. securities 4,247 1.46 1,169 6.10 158 2.20 — — 5,574 2.65
Corporate/Agency bonds 315 2.40 808 2.80 185 4.52 107 0.90 1,415 2.92
Other taxable securities 2,501 1.10 4,926 1.10 3,803 1.82 859 1.10 12,089 1.37
Total taxable securities 8,835 1.84 88,706 2.91 155,321 2.95 22,831 2.83 275,693 2.86
Tax-exempt securities 43 2.63 1,524 1.40 1,185 2.02 1,415 1.10 4,167 1.68
Total amortized cost of AFS debt securities $ 8,878 1.84 $ 90,230 2.88 $ 156,506 2.95 $ 24,246 2.72 $ 279,860 2.84
Total amortized cost of held-to-maturity debt securities (2) $ 6 5.00 $ 8,616 2.30 $ 40,836 2.40 $ 23 4.40 $ 49,481 2.40
Fair value of AFS debt securities
U.S. Treasury and agency securities $ 549 $ 883 $ 2,072 $ 20,968 $ 24,472
Mortgage-backed securities:
Agency 7 61,234 126,619 289 188,149
Agency-collateralized mortgage obligations 11 12,827 24,684 16 37,538
Non-agency residential 749 5,239 2,841 665 9,494
Non-agency commercial 477 3,405 24 18 3,924
Non-U.S. securities 4,244 1,211 163 — 5,618
Corporate/Agency bonds 320 826 207 97 1,450
Other taxable securities 2,502 4,947 3,825 854 12,128
Total taxable securities 8,859 90,572 160,435 22,907 282,773
Tax-exempt securities 43 1,526 1,184 1,380 4,133
Total fair value of AFS debt securities $ 8,902 $ 92,098 $ 161,619 $ 24,287 $ 286,906
Total fair value of held-to-maturity debt securities (2) $6 $ 8,790 $ 41,451 $ 23 $ 50,270
(1) Average yield is computed using the effective yield of each security at the end of the period, weighted based on the amortized cost of each security. The effective yield considers the contractual
coupon, amortization of premiums and accretion of discounts, and excludes the effect of related hedging derivatives.
(2) Substantially all U.S. agency mortgage-backed securities.