Bank of America 2012 Annual Report Download - page 89
Download and view the complete annual report
Please find page 89 of the 2012 Bank of America annual report below. You can navigate through the pages in the report by either clicking on the pages listed below, or by using the keyword search tool below to find specific information within the annual report.-
 1
1 -
2
-
3
-
4
-
5
-
6
-
7
-
8
-
9
-
10
-
11
-
12
-
13
-
14
-
15
-
16
-
17
-
18
-
19
-
20
-
21
-
22
-
23
-
24
-
25
-
26
-
27
-
28
-
29
-
30
-
31
-
32
-
33
-
34
-
35
-
36
-
37
-
38
-
39
-
40
-
41
-
42
-
43
-
44
-
45
-
46
-
47
-
48
-
49
-
50
-
51
-
52
-
53
-
54
-
55
-
56
-
57
-
58
-
59
-
60
-
61
-
62
-
63
-
64
-
65
-
66
-
67
-
68
-
69
-
70
-
71
-
72
-
73
-
74
-
75
-
76
-
77
-
78
-
 79
79 -
 80
80 -
 81
81 -
 82
82 -
 83
83 -
 84
84 -
 85
85 -
 86
86 -
 87
87 -
 88
88 -
 89
89 -
 90
90 -
 91
91 -
 92
92 -
 93
93 -
 94
94 -
 95
95 -
 96
96 -
 97
97 -
 98
98 -
 99
99 -
100
-
101
-
102
-
103
-
104
-
105
-
106
-
107
-
108
-
109
-
110
-
111
-
112
-
113
-
114
-
115
-
116
-
117
-
118
-
119
-
120
-
121
-
122
-
123
-
124
-
125
-
126
-
127
-
128
-
129
-
130
-
131
-
132
-
133
-
134
-
135
-
136
-
137
-
138
-
139
-
140
-
141
-
142
-
143
-
144
-
145
-
146
-
147
-
148
-
149
-
150
-
151
-
152
-
153
-
154
-
155
-
156
-
157
-
158
-
159
-
160
-
161
-
162
-
163
-
164
-
165
-
166
-
167
-
168
-
169
-
170
-
171
-
172
-
173
-
174
-
175
-
176
-
177
-
178
-
179
-
180
-
181
-
182
-
183
-
184
-
185
-
186
-
187
-
188
-
189
-
190
-
191
-
192
-
193
-
194
-
195
-
196
-
197
-
198
-
199
-
200
-
201
-
202
-
203
-
204
-
205
-
206
-
207
-
208
-
209
-
210
-
211
-
212
-
213
-
214
-
215
-
216
-
217
-
218
-
219
-
220
-
221
-
222
-
223
-
224
-
225
-
226
-
227
-
228
-
229
-
230
-
231
-
232
-
233
-
234
-
235
-
236
-
237
-
238
-
239
-
240
-
241
-
242
-
243
-
244
-
245
-
246
-
247
-
248
-
249
-
250
-
251
-
252
-
253
-
254
-
255
-
256
-
257
-
258
-
259
-
260
-
261
-
262
-
263
-
264
-
265
-
266
-
267
-
268
-
269
-
270
-
271
-
272
-
273
-
274
-
275
-
276
-
277
-
278
-
279
-
280
-
281
-
282
-
283
-
284
 |
 |

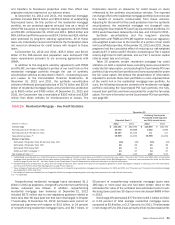
Bank of America 2012 87
PCI residential mortgage loan portfolio at December 31, 2012.
Loans with a refreshed LTV greater than 90 percent, after
consideration of purchase accounting adjustments and the related
valuation allowance, represented 60 percent of the Countrywide
PCI residential mortgage loan portfolio and 80 percent based on
the unpaid principal balance at December 31, 2012. Those loans
that were originally classified as Countrywide PCI discontinued real
estate loans upon acquisition and have been subsequently
modified are now included in the Countrywide PCI residential
mortgage outstandings. Table 30 presents outstandings net of
purchase accounting adjustments and before the related valuation
allowance, by certain state concentrations.
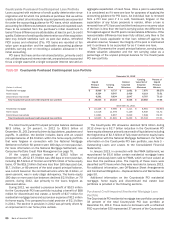
Table 30 Outstanding Countrywide Purchased Credit-
impaired Loan Portfolio – Residential
Mortgage State Concentrations
December 31
(Dollars in millions) 2012 2011
California $ 4,762 $ 5,509
Florida (1) 693 779
Virginia 479 535
Maryland 239 262
Texas 107 130
Other U.S./Non-U.S. 2,457 2,751
Total $ 8,737 $ 9,966
(1) In this state, foreclosure requires a court order following a legal proceeding (judicial state).
Purchased Credit-impaired Home Equity Loan Portfolio
The Countrywide PCI home equity portfolio comprised 33 percent
of the total Countrywide PCI loan portfolio at December 31, 2012.
Those loans with a refreshed FICO score below 620 represented
23 percent of the Countrywide PCI home equity portfolio at
December 31, 2012. Loans with a refreshed CLTV greater than
90 percent, after consideration of purchase accounting
adjustments and the related valuation allowance, represented 76
percent of the Countrywide PCI home equity portfolio and 77
percent based on the unpaid principal balance at December 31,
2012. Table 31 presents outstandings net of purchase accounting
adjustments and before the related valuation allowance, by certain
state concentrations.
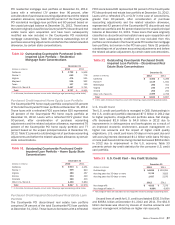
Table 31 Outstanding Countrywide Purchased Credit-
impaired Loan Portfolio – Home Equity State
Concentrations
December 31
(Dollars in millions) 2012 2011
California $ 2,614 $ 4,051
Florida (1) 509 840
Virginia 380 467
Arizona 294 422
Colorado 260 335
Other U.S./Non-U.S. 4,490 5,863
Total $ 8,547 $ 11,978
(1) In this state, foreclosure requires a court order following a legal proceeding (judicial state).
Purchased Credit-impaired Discontinued Real Estate Loan
Portfolio
The Countrywide PCI discontinued real estate loan portfolio
comprised 34 percent of the total Countrywide PCI loan portfolio
at December 31, 2012. Those loans to borrowers with a refreshed
FICO score below 620 represented 62 percent of the Countrywide
PCI discontinued real estate loan portfolio at December 31, 2012.
Loans with a refreshed LTV, or CLTV in the case of second-liens,
greater than 90 percent, after consideration of purchase
accounting adjustments and the related valuation allowance,
represented 42 percent of the Countrywide PCI discontinued real
estate loan portfolio and 81 percent based on the unpaid principal
balance at December 31, 2012. Those loans that were originally
classified as discontinued real estate loans upon acquisition and
have been subsequently modified are now excluded from this
portfolio and included in the Countrywide PCI residential mortgage
loan portfolio, but remain in the PCI loan pool. Table 32 presents
outstandings net of purchase accounting adjustments and before
the related valuation adjustment, by certain state concentrations.
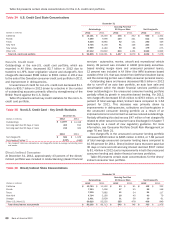
Table 32 Outstanding Countrywide Purchased Credit-
impaired Loan Portfolio – Discontinued Real
Estate State Concentrations
December 31
(Dollars in millions) 2012 2011
California $ 4,492 $ 5,285
Florida (1) 1,119 1,041
Washington 282 311
Virginia 240 273
Arizona 202 241
Other U.S./Non-U.S. 2,499 2,706
Total $ 8,834 $ 9,857
(1) In this state, foreclosure requires a court order following a legal proceeding (judicial state).
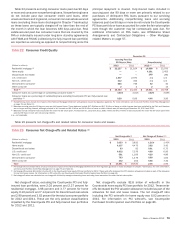
U.S. Credit Card
The U.S. credit card portfolio is managed in CBB. Outstandings in
the U.S. credit card portfolio decreased $7.5 billion in 2012 due
to higher payments, charge-offs and portfolio sales. Net charge-
offs decreased $2.6 billion to $4.6 billion in 2012 due to
improvements in delinquencies and bankruptcies as a result of
an improved economic environment, account management on
higher risk accounts and the impact of higher credit quality
originations. U.S. credit card loans 30 days or more past due and
still accruing interest decreased $1.1 billion while loans 90 days
or more past due and still accruing interest decreased $633 million
in 2012 due to improvement in the U.S. economy. Table 33
presents certain key credit statistics for the consumer U.S. credit
card portfolio.
Table 33 U.S. Credit Card – Key Credit Statistics
December 31
(Dollars in millions) 2012 2011
Outstandings $ 94,835 $ 102,291
Accruing past due 30 days or more 2,748 3,823
Accruing past due 90 days or more 1,437 2,070
2012 2011
Net charge-offs $ 4,632 $ 7,276
Net charge-off ratios (1) 4.88% 6.90%
(1) Net charge-off ratios are calculated as net charge-offs divided by average outstanding loans.
Unused lines of credit for U.S. credit card totaled $335.5 billion
and $368.1 billion at December 31, 2012 and 2011. The $32.6
billion decrease was driven by closure of inactive accounts and
account management initiatives on higher risk accounts.