Bank of America 2012 Annual Report Download - page 105
Download and view the complete annual report
Please find page 105 of the 2012 Bank of America annual report below. You can navigate through the pages in the report by either clicking on the pages listed below, or by using the keyword search tool below to find specific information within the annual report.-
 1
1 -
2
-
3
-
4
-
5
-
6
-
7
-
8
-
9
-
10
-
11
-
12
-
13
-
14
-
15
-
16
-
17
-
18
-
19
-
20
-
21
-
22
-
23
-
24
-
25
-
26
-
27
-
28
-
29
-
30
-
31
-
32
-
33
-
34
-
35
-
36
-
37
-
38
-
39
-
40
-
41
-
42
-
43
-
44
-
45
-
46
-
47
-
48
-
49
-
50
-
51
-
52
-
53
-
54
-
55
-
56
-
57
-
58
-
59
-
60
-
61
-
62
-
63
-
64
-
65
-
66
-
67
-
68
-
69
-
70
-
71
-
72
-
73
-
74
-
75
-
76
-
77
-
78
-
79
-
80
-
81
-
82
-
83
-
84
-
85
-
86
-
87
-
88
-
89
-
90
-
91
-
92
-
93
-
94
-
 95
95 -
 96
96 -
 97
97 -
 98
98 -
 99
99 -
 100
100 -
 101
101 -
 102
102 -
 103
103 -
 104
104 -
 105
105 -
 106
106 -
 107
107 -
 108
108 -
 109
109 -
 110
110 -
 111
111 -
 112
112 -
 113
113 -
 114
114 -
 115
115 -
116
-
117
-
118
-
119
-
120
-
121
-
122
-
123
-
124
-
125
-
126
-
127
-
128
-
129
-
130
-
131
-
132
-
133
-
134
-
135
-
136
-
137
-
138
-
139
-
140
-
141
-
142
-
143
-
144
-
145
-
146
-
147
-
148
-
149
-
150
-
151
-
152
-
153
-
154
-
155
-
156
-
157
-
158
-
159
-
160
-
161
-
162
-
163
-
164
-
165
-
166
-
167
-
168
-
169
-
170
-
171
-
172
-
173
-
174
-
175
-
176
-
177
-
178
-
179
-
180
-
181
-
182
-
183
-
184
-
185
-
186
-
187
-
188
-
189
-
190
-
191
-
192
-
193
-
194
-
195
-
196
-
197
-
198
-
199
-
200
-
201
-
202
-
203
-
204
-
205
-
206
-
207
-
208
-
209
-
210
-
211
-
212
-
213
-
214
-
215
-
216
-
217
-
218
-
219
-
220
-
221
-
222
-
223
-
224
-
225
-
226
-
227
-
228
-
229
-
230
-
231
-
232
-
233
-
234
-
235
-
236
-
237
-
238
-
239
-
240
-
241
-
242
-
243
-
244
-
245
-
246
-
247
-
248
-
249
-
250
-
251
-
252
-
253
-
254
-
255
-
256
-
257
-
258
-
259
-
260
-
261
-
262
-
263
-
264
-
265
-
266
-
267
-
268
-
269
-
270
-
271
-
272
-
273
-
274
-
275
-
276
-
277
-
278
-
279
-
280
-
281
-
282
-
283
-
284
 |
 |

Bank of America 2012 103
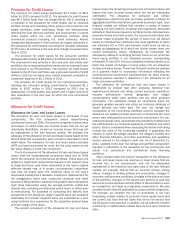
Certain European countries, including Greece, Ireland, Italy,
Portugal and Spain, have experienced varying degrees of financial
stress in recent years. Risks from the ongoing debt crisis in these
countries could continue to disrupt the financial markets which
could have a detrimental impact on global economic conditions
and sovereign and non-sovereign debt in these countries. In the
fourth quarter of 2012, European policymakers continued to make
incremental progress toward greater fiscal and monetary unity;
however, fundamental issues of competitiveness, growth and fiscal
solvency remain as challenges. As a result, volatility is expected
to continue. We expect to continue to support client activities in
the region and our exposures may vary over time as we monitor
the situation and manage our risk profile.
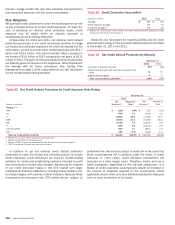
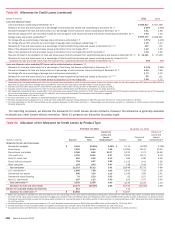
Table 57 presents our direct sovereign and non-sovereign
exposures in these countries at December 31, 2012. Our total
sovereign and non-sovereign exposure to these countries was
$14.5 billion at December 31, 2012 compared to $15.2 billion at
December 31, 2011. The total exposure to these countries, net
of all hedges, was $9.5 billion at December 31, 2012 compared
to $10.3 billion at December 31, 2011, of which $280 million and
$362 million was sovereign exposure. At December 31, 2012 and
2011, the value of hedges and credit default protection purchased,
net of credit default protection sold, was $5.1 billion and $4.9
billion.
Table 57 Select European Countries
(Dollars in millions)
Funded Loans
and Loan
Equivalents
Unfunded
Loan
Commitments
Net
Counterparty
Exposure (1)
Securities/
Other
Investments (2)
Country
Exposure at
December 31
2012
Hedges and
Credit Default
Protection (3)
Net Country
Exposure at
December 31
2012
Increase
(Decrease) from
December 31
2011
Greece
Sovereign $ —$ —$ —$ 2$ 2$ —$2
$ (27)
Financial institutions — — — 6 6 (11) (5)(2)
Corporates 173 139 19 2 333 (24) 309 (125)
Total Greece $ 173 $ 139 $ 19 $ 10 $ 341 $ (35) $306 $ (154)
Ireland
Sovereign $ 19 $ — $ 27 $ 22 $ 68 $ (10) $58 $ (63)
Financial institutions 437 31 106 40 614 (22) 592 (206)
Corporates 587 300 32 33 952 (23) 929 (566)
Total Ireland $ 1,043 $ 331 $ 165 $ 95 $ 1,634 $ (55) $ 1,579 $ (835)
Italy
Sovereign $ 14 $ — $ 1,843 $ 58 $ 1,915 $ (1,885) $30 $ (184)
Financial institutions 1,373 18 200 85 1,676 (599) 1,077 (654)
Corporates 1,471 2,807 252 378 4,908 (1,177) 3,731 821
Total Italy $ 2,858 $ 2,825 $ 2,295 $ 521 $ 8,499 $ (3,661) $ 4,838 $ (17)
Portugal
Sovereign $ — $ — $ 31 $ — $ 31 $ (68) $ (37) $ (28)
Financial institutions 4 — 1 49 54 (16) 38 34
Corporates 194 43 4 8 249 (164) 85 24
Total Portugal $ 198 $ 43 $ 36 $ 57 $ 334 $ (248) $86 $30
Spain
Sovereign $ 35 $ — $ 64 $ 182 $ 281 $ (54) $227 $ 220
Financial institutions 42 7 69 162 280 (122) 158 (504)
Corporates 1,822 1,011 59 260 3,152 (883) 2,269 401
Total Spain $ 1,899 $ 1,018 $ 192 $ 604 $ 3,713 $ (1,059) $ 2,654 $ 117
Total
Sovereign $ 68 $ — $ 1,965 $ 264 $ 2,297 $ (2,017) $280 $ (82)
Financial institutions 1,856 56 376 342 2,630 (770) 1,860 (1,332)
Corporates 4,247 4,300 366 681 9,594 (2,271) 7,323 555
Total select European
exposure $ 6,171 $ 4,356 $ 2,707 $ 1,287 $ 14,521 $ (5,058) $ 9,463 $ (859)
(1) Net counterparty exposure includes the fair value of derivatives including the counterparty risk associated with credit default protection and secured financing transactions. Derivatives are presented
net of $3.1 billion in collateral, predominantly in cash, pledged under legally enforceable netting agreements. Secured financing transactions are presented net of eligible cash or securities pledged.
The notional amount of reverse repurchase transactions was $1.3 billion at December 31, 2012. Counterparty exposure is not presented net of hedges or credit default protection.
(2) Long securities exposures have been netted on a single-name basis to, but not below, zero by short positions of $6.5 billion and net CDS purchased of $1.8 billion, consisting of $2.0 billion of net
single-name CDS purchased and $207 million of net index and tranched CDS sold.
(3) Represents credit default protection purchased, net of credit default protection sold, which is used to mitigate the Corporation’s risk to country exposures as listed, including $2.7 billion, consisting
of $3.0 billion in net single-name CDS purchased and $346 million in net index and tranched CDS sold, to hedge loans and securities, $2.3 billion in additional credit default protection purchased
to hedge derivative assets and $60 million in other short positions.
The majority of our CDS contracts on reference assets in
Greece, Ireland, Italy, Portugal and Spain are with highly-rated
financial institutions primarily outside of the Eurozone and we work
to limit or eliminate correlated CDS. Due to our engagement in
market-making activities, our CDS portfolio contains contracts with
various maturities to a diverse set of counterparties. We work to
limit mismatches in maturities between our exposures and the
CDS we use to hedge them. However, there may be instances
where the protection purchased has a different maturity from the
exposure for which the protection was purchased, in which case,
those exposures and hedges are subject to more active monitoring
and management.