Bank of America 2012 Annual Report Download - page 26
Download and view the complete annual report
Please find page 26 of the 2012 Bank of America annual report below. You can navigate through the pages in the report by either clicking on the pages listed below, or by using the keyword search tool below to find specific information within the annual report.-
 1
1 -
2
-
3
-
4
-
5
-
6
-
7
-
8
-
9
-
10
-
11
-
12
-
13
-
14
-
15
-
 16
16 -
 17
17 -
 18
18 -
 19
19 -
 20
20 -
 21
21 -
 22
22 -
 23
23 -
 24
24 -
 25
25 -
 26
26 -
 27
27 -
 28
28 -
 29
29 -
 30
30 -
 31
31 -
 32
32 -
 33
33 -
 34
34 -
 35
35 -
 36
36 -
37
-
38
-
39
-
40
-
41
-
42
-
43
-
44
-
45
-
46
-
47
-
48
-
49
-
50
-
51
-
52
-
53
-
54
-
55
-
56
-
57
-
58
-
59
-
60
-
61
-
62
-
63
-
64
-
65
-
66
-
67
-
68
-
69
-
70
-
71
-
72
-
73
-
74
-
75
-
76
-
77
-
78
-
79
-
80
-
81
-
82
-
83
-
84
-
85
-
86
-
87
-
88
-
89
-
90
-
91
-
92
-
93
-
94
-
95
-
96
-
97
-
98
-
99
-
100
-
101
-
102
-
103
-
104
-
105
-
106
-
107
-
108
-
109
-
110
-
111
-
112
-
113
-
114
-
115
-
116
-
117
-
118
-
119
-
120
-
121
-
122
-
123
-
124
-
125
-
126
-
127
-
128
-
129
-
130
-
131
-
132
-
133
-
134
-
135
-
136
-
137
-
138
-
139
-
140
-
141
-
142
-
143
-
144
-
145
-
146
-
147
-
148
-
149
-
150
-
151
-
152
-
153
-
154
-
155
-
156
-
157
-
158
-
159
-
160
-
161
-
162
-
163
-
164
-
165
-
166
-
167
-
168
-
169
-
170
-
171
-
172
-
173
-
174
-
175
-
176
-
177
-
178
-
179
-
180
-
181
-
182
-
183
-
184
-
185
-
186
-
187
-
188
-
189
-
190
-
191
-
192
-
193
-
194
-
195
-
196
-
197
-
198
-
199
-
200
-
201
-
202
-
203
-
204
-
205
-
206
-
207
-
208
-
209
-
210
-
211
-
212
-
213
-
214
-
215
-
216
-
217
-
218
-
219
-
220
-
221
-
222
-
223
-
224
-
225
-
226
-
227
-
228
-
229
-
230
-
231
-
232
-
233
-
234
-
235
-
236
-
237
-
238
-
239
-
240
-
241
-
242
-
243
-
244
-
245
-
246
-
247
-
248
-
249
-
250
-
251
-
252
-
253
-
254
-
255
-
256
-
257
-
258
-
259
-
260
-
261
-
262
-
263
-
264
-
265
-
266
-
267
-
268
-
269
-
270
-
271
-
272
-
273
-
274
-
275
-
276
-
277
-
278
-
279
-
280
-
281
-
282
-
283
-
284
 |
 |

24 Bank of America 2012
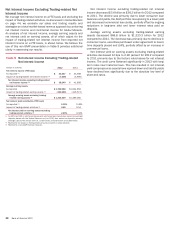
Noninterest income decreased $6.2 billion to $42.7 billion for
2012 compared to 2011. The following highlights the significant
changes.
Card income decreased $1.1 billion primarily driven by the
implementation of interchange fee rules under the Durbin
Amendment, which became effective on October 1, 2011.
Service charges decreased $494 million primarily due to the
impact of lower accretion on acquired portfolios and reduced
reimbursed merchant processing fees.
Investment and brokerage services income decreased $433
million primarily driven by lower transactional volumes.
Equity investment income decreased $5.3 billion. The results
for 2012 included $1.6 billion of gains which primarily related
to the sales of certain equity and strategic investments. The
results for 2011 included $6.5 billion of gains on the sale of
China Construction Bank (CCB) shares, $836 million of CCB
dividends and a $377 million gain on the sale of our investment
in BlackRock, Inc. (BlackRock), partially offset by $1.1 billion of
impairment charges on our merchant services joint venture.
Trading account profits decreased $827 million. Net DVA losses
on derivatives were $2.5 billion in 2012 compared to net DVA
gains of $1.0 billion in 2011. Excluding net DVA, trading account
profits increased $2.7 billion in 2012 compared to 2011 due
to an improved market environment.
Mortgage banking income increased $13.6 billion primarily due
to an $11.7 billion decrease in the representations and
warranties provision. The 2012 results included $2.5 billion in
provision related to the FNMA Settlement, a $500 million
provision for obligations to FNMA related to mortgage insurance
rescissions, partially offset by an increase in servicing income
of $1.1 billion due to improved MSR results. The 2011 results
included $15.6 billion in representations and warranties
provision related to the agreement to resolve nearly all legacy
Countrywide-issued first-lien non-government-sponsored
enterprise (GSE) residential mortgage-backed securities
(RMBS) repurchase exposures and other non-GSE exposures.
Insurance income decreased $1.5 billion driven by the impact
of the sale of the Balboa Insurance Company’s lender-placed
insurance business (Balboa) in 2011 and an increase to the
provision related to payment protection insurance in the U.K. in
2012.
Other income decreased $8.7 billion due to negative fair value
adjustments on our structured liabilities of $5.1 billion
compared to positive fair value adjustments of $3.3 billion in
2011. In addition, 2012 included $1.6 billion of gains related
to debt repurchases and exchanges of trust preferred securities
compared to gains of $1.2 billion in the prior year. The prior year
also included a net gain of $752 million on the sale of Balboa.
Provision for Credit Losses
The provision for credit losses decreased $5.2 billion to $8.2
billion for 2012 compared to 2011. The provision for credit losses
was $6.7 billion lower than net charge-offs for 2012, resulting in
a reduction in the allowance for credit losses driven by improved
portfolio trends and increasing home prices in consumer real
estate products, lower bankruptcy filings and delinquencies
affecting the Card Services portfolio, and improvement in overall
credit quality within the core commercial portfolio (total
commercial products excluding U.S. small business). Absent
unexpected deterioration in the economy, we expect reductions in
the allowance for credit losses, excluding the valuation allowance
for purchase credit-impaired (PCI) loans, to continue in the near
term, though at a slower pace than in 2012. For more information
on the provision for credit losses, see Provision for Credit Losses
on page 105.
Net charge-offs totaled $14.9 billion, or 1.67 percent of average
loans and leases for 2012 compared to $20.8 billion, or 2.24
percent for 2011. Included in 2012 net charge-offs was $596
million related to the impact of new regulatory guidance regarding
the treatment of loans discharged in Chapter 7 bankruptcy and
$435 million related to loans forgiven as a part of the National
Mortgage Settlement. The decrease in net charge-offs was
primarily driven by fewer delinquent loans and lower bankruptcy
filings in the Card Services portfolio, as well as lower net charge-
offs in the consumer real estate and core commercial portfolios
in 2012.
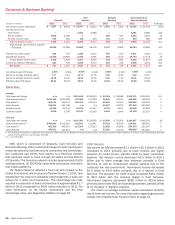
Noninterest Expense
Table 4 Noninterest Expense
(Dollars in millions) 2012 2011
Personnel $ 35,648 $ 36,965
Occupancy 4,570 4,748
Equipment 2,269 2,340
Marketing 1,873 2,203
Professional fees 3,574 3,381
Amortization of intangibles 1,264 1,509
Data processing 2,961 2,652
Telecommunications 1,660 1,553
Other general operating 18,274 21,101
Goodwill impairment —3,184
Merger and restructuring charges —638
Total noninterest expense $ 72,093 $ 80,274
Noninterest expense decreased $8.2 billion to $72.1 billion
for 2012 compared to 2011 with the decrease primarily driven by
the absence of goodwill impairment charges in 2012 compared
to $3.2 billion in 2011, a $2.8 billion decrease in other general
operating expense primarily related to lower litigation expense and
mortgage-related assessments, waivers and similar costs related
to foreclosure delays, partially offset by a provision of $1.1 billion
in 2012 related to the 2013 IFR Acceleration Agreement.
Personnel expense decreased $1.3 billion in 2012 as we
continued to streamline processes and achieve cost savings.
Partially offsetting the decreases were increases in professional
fees and data processing expenses due to continuing default
management activities in Legacy Assets & Servicing. The prior
year also included $638 million in merger and restructuring
charges.
In connection with Project New BAC, we expect to continue to
achieve cost savings in certain noninterest expense categories as
we continue to further streamline workflows, simplify processes
and align expenses with our overall strategic plan and operating
principles. During 2012, we continued implementation of Phase
1 initiatives, completed Phase 2 evaluations and began
implementation of certain Phase 2 initiatives. With regard to Phase
1, we expect to realize more than $5 billion of annualized cost
savings by the fourth quarter of 2013 with the full impact expected
to be realized in 2014. We expect that Phase 2 will result in an
additional $3 billion of annualized cost savings by mid-2015.