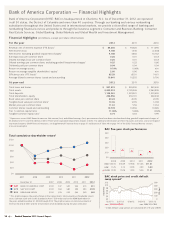
Bank of America 2012 Annual Report Download - page 28
Download and view the complete annual report
Please find page 28 of the 2012 Bank of America annual report below. You can navigate through the pages in the report by either clicking on the pages listed below, or by using the keyword search tool below to find specific information within the annual report.-
 1
1 -
2
-
3
-
4
-
5
-
6
-
7
-
8
-
9
-
10
-
11
-
12
-
13
-
14
-
15
-
16
-
17
-
 18
18 -
 19
19 -
 20
20 -
 21
21 -
 22
22 -
 23
23 -
 24
24 -
 25
25 -
 26
26 -
 27
27 -
 28
28 -
 29
29 -
 30
30 -
 31
31 -
 32
32 -
 33
33 -
 34
34 -
 35
35 -
 36
36 -
 37
37 -
 38
38 -
39
-
40
-
41
-
42
-
43
-
44
-
45
-
46
-
47
-
48
-
49
-
50
-
51
-
52
-
53
-
54
-
55
-
56
-
57
-
58
-
59
-
60
-
61
-
62
-
63
-
64
-
65
-
66
-
67
-
68
-
69
-
70
-
71
-
72
-
73
-
74
-
75
-
76
-
77
-
78
-
79
-
80
-
81
-
82
-
83
-
84
-
85
-
86
-
87
-
88
-
89
-
90
-
91
-
92
-
93
-
94
-
95
-
96
-
97
-
98
-
99
-
100
-
101
-
102
-
103
-
104
-
105
-
106
-
107
-
108
-
109
-
110
-
111
-
112
-
113
-
114
-
115
-
116
-
117
-
118
-
119
-
120
-
121
-
122
-
123
-
124
-
125
-
126
-
127
-
128
-
129
-
130
-
131
-
132
-
133
-
134
-
135
-
136
-
137
-
138
-
139
-
140
-
141
-
142
-
143
-
144
-
145
-
146
-
147
-
148
-
149
-
150
-
151
-
152
-
153
-
154
-
155
-
156
-
157
-
158
-
159
-
160
-
161
-
162
-
163
-
164
-
165
-
166
-
167
-
168
-
169
-
170
-
171
-
172
-
173
-
174
-
175
-
176
-
177
-
178
-
179
-
180
-
181
-
182
-
183
-
184
-
185
-
186
-
187
-
188
-
189
-
190
-
191
-
192
-
193
-
194
-
195
-
196
-
197
-
198
-
199
-
200
-
201
-
202
-
203
-
204
-
205
-
206
-
207
-
208
-
209
-
210
-
211
-
212
-
213
-
214
-
215
-
216
-
217
-
218
-
219
-
220
-
221
-
222
-
223
-
224
-
225
-
226
-
227
-
228
-
229
-
230
-
231
-
232
-
233
-
234
-
235
-
236
-
237
-
238
-
239
-
240
-
241
-
242
-
243
-
244
-
245
-
246
-
247
-
248
-
249
-
250
-
251
-
252
-
253
-
254
-
255
-
256
-
257
-
258
-
259
-
260
-
261
-
262
-
263
-
264
-
265
-
266
-
267
-
268
-
269
-
270
-
271
-
272
-
273
-
274
-
275
-
276
-
277
-
278
-
279
-
280
-
281
-
282
-
283
-
284
 |
 |
26 Bank of America 2012
Assets
Federal Funds Sold and Securities Borrowed or Purchased
Under Agreements to Resell
Federal funds transactions involve lending reserve balances on a
short-term basis. Securities borrowed and securities purchased
under agreements to resell are utilized to accommodate customer
transactions, earn interest rate spreads, and obtain securities for
settlement and for collateral. Year-end federal funds sold and
securities borrowed under agreements to resell increased $8.7
billion due to increases in client short positions and increased
collateral requirements. Average federal funds sold and securities
borrowed or purchased under agreements to resell decreased $9.0
billion attributable to changes in the investment composition of
excess liquidity.
Trading Account Assets
Trading account assets consist primarily of fixed-income securities
including government and corporate debt, and equity and
convertible instruments. Year-end trading account assets
increased $67.9 billion primarily due to a strategic decision to
increase U.S. Treasuries and agency securities.
Debt Securities
Debt securities primarily include U.S. Treasury and agency
securities, MBS, principally agency MBS, foreign bonds, corporate
bonds and municipal debt. We use the debt securities portfolio
primarily to manage interest rate and liquidity risk and to take
advantage of market conditions that create more economically
attractive returns on these investments. Year-end balances of debt
securities increased $25.0 billion primarily due to net purchases
of agency MBS. For additional information on debt securities, see
Note 4 – Securities to the Consolidated Financial Statements.
Loans and Leases
Year-end and average loans and leases decreased $18.4 billion
and $39.3 billion. The decreases were primarily due to continued
run-off in targeted portfolios partially offset by growth in non-U.S.
commercial and U.S. commercial loans. For a more detailed
discussion of the loan portfolio, see Credit Risk Management on
page 75.
Allowance for Loan and Lease Losses
Year-end and average allowance for loan and lease losses
decreased $9.6 billion and $7.8 billion primarily due to the impact
of the improving economy and reserve reductions in the PCI
portfolio mostly related to the National Mortgage Settlement. For
a more detailed discussion, see Allowance for Credit Losses on
page 105.
All Other Assets
Year-end other assets decreased $11.9 billion driven by lower cash
and cash equivalent balances. Average other assets decreased
$59.9 billion primarily driven by asset sales, lower derivative dealer
assets and a reduction in loans held-for-sale (LHFS).
Liabilities
Deposits
Year-end and average deposits increased $72.2 billion and $12.0
billion. The increases were attributable to growth in our noninterest-
bearing deposits driven by higher client balances.
Federal Funds Purchased and Securities Loaned or Sold
Under Agreements to Repurchase
Federal funds transactions involve borrowing reserve balances on
a short-term basis. Securities loaned and securities sold under
agreements to repurchase are collateralized borrowing
transactions utilized to accommodate customer transactions, earn
interest rate spreads and finance assets on the balance sheet.
Year-end and average federal funds purchased and securities
loaned or sold under agreements to repurchase increased $78.4
billion and $9.5 billion primarily due to funding of trading inventory
resulting from customer demand.
Trading Account Liabilities
Trading account liabilities consist primarily of short positions in
fixed-income securities including government and corporate debt,
equity and convertible instruments. Year-end trading account
liabilities increased $13.1 billion primarily due to higher trading
activity in equity securities. Average trading account liabilities
decreased $6.1 billion primarily due to a decrease in basis trading
on government debt.
Commercial Paper and Other Short-term Borrowings
Commercial paper and other short-term borrowings provide an
additional funding source. Year-end and average commercial paper
and other short-term borrowings decreased $5.0 billion and $15.4
billion due to planned reductions in wholesale borrowings. For
additional information on Commercial Paper and Other Short-term
Borrowings, see Note 11 – Federal Funds Sold, Securities Borrowed
or Purchased Under Agreements to Resell and Short-term
Borrowings to the Consolidated Financial Statements.
Long-term Debt
Year-end and average long-term debt decreased $96.7 billion and
$104.8 billion. The decreases were attributable to planned
reductions in long-term debt. For additional information on long-
term debt, see Note 12 – Long-term Debt to the Consolidated
Financial Statements.
All Other Liabilities
Year-end all other liabilities increased $12.0 billion primarily driven
by an increase in customer margin credits. Average all other
liabilities decreased $6.7 billion primarily driven by decreases in
bank acceptances outstanding and accrued interest payable.
Shareholders’ Equity
Year-end and average shareholders’ equity increased $6.9 billion
and $6.6 billion. The increases were primarily driven by earnings,
an increase in unrealized gains on available-for-sale (AFS) debt
securities in other comprehensive income (OCI), and common
stock issued under employee plans and in connection with
exchanges of preferred stock and trust preferred securities.