Bank of America 2012 Annual Report Download - page 136
Download and view the complete annual report
Please find page 136 of the 2012 Bank of America annual report below. You can navigate through the pages in the report by either clicking on the pages listed below, or by using the keyword search tool below to find specific information within the annual report.-
 1
1 -
2
-
3
-
4
-
5
-
6
-
7
-
8
-
9
-
10
-
11
-
12
-
13
-
14
-
15
-
16
-
17
-
18
-
19
-
20
-
21
-
22
-
23
-
24
-
25
-
26
-
27
-
28
-
29
-
30
-
31
-
32
-
33
-
34
-
35
-
36
-
37
-
38
-
39
-
40
-
41
-
42
-
43
-
44
-
45
-
46
-
47
-
48
-
49
-
50
-
51
-
52
-
53
-
54
-
55
-
56
-
57
-
58
-
59
-
60
-
61
-
62
-
63
-
64
-
65
-
66
-
67
-
68
-
69
-
70
-
71
-
72
-
73
-
74
-
75
-
76
-
77
-
78
-
79
-
80
-
81
-
82
-
83
-
84
-
85
-
86
-
87
-
88
-
89
-
90
-
91
-
92
-
93
-
94
-
95
-
96
-
97
-
98
-
99
-
100
-
101
-
102
-
103
-
104
-
105
-
106
-
107
-
108
-
109
-
110
-
111
-
112
-
113
-
114
-
115
-
116
-
117
-
118
-
119
-
120
-
121
-
122
-
123
-
124
-
125
-
 126
126 -
 127
127 -
 128
128 -
 129
129 -
 130
130 -
 131
131 -
 132
132 -
 133
133 -
 134
134 -
 135
135 -
 136
136 -
 137
137 -
 138
138 -
 139
139 -
 140
140 -
 141
141 -
 142
142 -
 143
143 -
 144
144 -
 145
145 -
 146
146 -
147
-
148
-
149
-
150
-
151
-
152
-
153
-
154
-
155
-
156
-
157
-
158
-
159
-
160
-
161
-
162
-
163
-
164
-
165
-
166
-
167
-
168
-
169
-
170
-
171
-
172
-
173
-
174
-
175
-
176
-
177
-
178
-
179
-
180
-
181
-
182
-
183
-
184
-
185
-
186
-
187
-
188
-
189
-
190
-
191
-
192
-
193
-
194
-
195
-
196
-
197
-
198
-
199
-
200
-
201
-
202
-
203
-
204
-
205
-
206
-
207
-
208
-
209
-
210
-
211
-
212
-
213
-
214
-
215
-
216
-
217
-
218
-
219
-
220
-
221
-
222
-
223
-
224
-
225
-
226
-
227
-
228
-
229
-
230
-
231
-
232
-
233
-
234
-
235
-
236
-
237
-
238
-
239
-
240
-
241
-
242
-
243
-
244
-
245
-
246
-
247
-
248
-
249
-
250
-
251
-
252
-
253
-
254
-
255
-
256
-
257
-
258
-
259
-
260
-
261
-
262
-
263
-
264
-
265
-
266
-
267
-
268
-
269
-
270
-
271
-
272
-
273
-
274
-
275
-
276
-
277
-
278
-
279
-
280
-
281
-
282
-
283
-
284
 |
 |

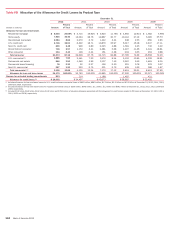
134 Bank of America 2012
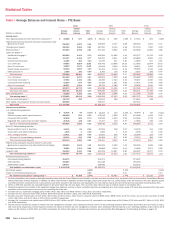
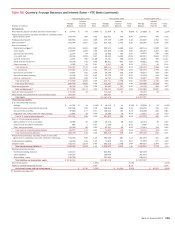
Table VIII Allocation of the Allowance for Credit Losses by Product Type
December 31
2012 2011 2010 2009 2008
(Dollars in millions) Amount
Percent
of Total Amount
Percent
of Total Amount
Percent
of Total Amount
Percent
of Total Amount
Percent
of Total
Allowance for loan and lease losses
Residential mortgage $ 5,004 20.69% $ 5,715 16.92% $ 4,923 11.76% $ 4,692 12.61% $ 1,382 5.99%
Home equity 7,845 32.45 13,094 38.76 12,887 30.77 10,116 27.19 5,385 23.34
Discontinued real estate 2,084 8.62 2,270 6.72 1,442 3.44 948 2.55 658 2.85
U.S. credit card 4,718 19.51 6,322 18.71 10,876 25.97 6,017 16.18 3,947 17.11
Non-U.S. credit card 600 2.48 946 2.80 2,045 4.88 1,581 4.25 742 3.22
Direct/Indirect consumer 718 2.97 1,153 3.41 2,381 5.68 4,227 11.36 4,341 18.81
Other consumer 104 0.43 148 0.44 161 0.38 204 0.55 203 0.88
Total consumer 21,073 87.15 29,648 87.76 34,715 82.88 27,785 74.69 16,658 72.20
U.S. commercial (1) 1,885 7.80 2,441 7.23 3,576 8.54 5,152 13.85 4,339 18.81
Commercial real estate 846 3.50 1,349 3.99 3,137 7.49 3,567 9.59 1,465 6.35
Commercial lease financing 78 0.32 92 0.27 126 0.30 291 0.78 223 0.97
Non-U.S. commercial 297 1.23 253 0.75 331 0.79 405 1.09 386 1.67
Total commercial (2) 3,106 12.85 4,135 12.24 7,170 17.12 9,415 25.31 6,413 27.80
Allowance for loan and lease losses 24,179 100.00% 33,783 100.00% 41,885 100.00% 37,200 100.00% 23,071 100.00%
Reserve for unfunded lending commitments 513 714 1,188 1,487 421
Allowance for credit losses (3) $ 24,692 $ 34,497 $ 43,073 $ 38,687 $ 23,492
(1) Includes allowance for loan and lease losses for U.S. small business commercial loans of $642 million, $893 million, $1.5 billion, $2.4 billion and $2.4 billion at December 31, 2012, 2011, 2010,
2009 and 2008, respectively.
(2) Includes allowance for loan and lease losses for impaired commercial loans of $330 million, $545 million, $1.1 billion, $1.2 billion and $691 million at December 31, 2012, 2011, 2010, 2009 and
2008, respectively.
(3) Includes $5.5 billion, $8.5 billion, $6.4 billion, $3.9 billion and $750 million of valuation allowance presented with the allowance for credit losses related to PCI loans at December 31, 2012, 2011,
2010, 2009 and 2008, respectively.