Bank of America 2012 Annual Report Download - page 82
Download and view the complete annual report
Please find page 82 of the 2012 Bank of America annual report below. You can navigate through the pages in the report by either clicking on the pages listed below, or by using the keyword search tool below to find specific information within the annual report.-
 1
1 -
2
-
3
-
4
-
5
-
6
-
7
-
8
-
9
-
10
-
11
-
12
-
13
-
14
-
15
-
16
-
17
-
18
-
19
-
20
-
21
-
22
-
23
-
24
-
25
-
26
-
27
-
28
-
29
-
30
-
31
-
32
-
33
-
34
-
35
-
36
-
37
-
38
-
39
-
40
-
41
-
42
-
43
-
44
-
45
-
46
-
47
-
48
-
49
-
50
-
51
-
52
-
53
-
54
-
55
-
56
-
57
-
58
-
59
-
60
-
61
-
62
-
63
-
64
-
65
-
66
-
67
-
68
-
69
-
70
-
71
-
 72
72 -
 73
73 -
 74
74 -
 75
75 -
 76
76 -
 77
77 -
 78
78 -
 79
79 -
 80
80 -
 81
81 -
 82
82 -
 83
83 -
 84
84 -
 85
85 -
 86
86 -
 87
87 -
 88
88 -
 89
89 -
 90
90 -
 91
91 -
 92
92 -
93
-
94
-
95
-
96
-
97
-
98
-
99
-
100
-
101
-
102
-
103
-
104
-
105
-
106
-
107
-
108
-
109
-
110
-
111
-
112
-
113
-
114
-
115
-
116
-
117
-
118
-
119
-
120
-
121
-
122
-
123
-
124
-
125
-
126
-
127
-
128
-
129
-
130
-
131
-
132
-
133
-
134
-
135
-
136
-
137
-
138
-
139
-
140
-
141
-
142
-
143
-
144
-
145
-
146
-
147
-
148
-
149
-
150
-
151
-
152
-
153
-
154
-
155
-
156
-
157
-
158
-
159
-
160
-
161
-
162
-
163
-
164
-
165
-
166
-
167
-
168
-
169
-
170
-
171
-
172
-
173
-
174
-
175
-
176
-
177
-
178
-
179
-
180
-
181
-
182
-
183
-
184
-
185
-
186
-
187
-
188
-
189
-
190
-
191
-
192
-
193
-
194
-
195
-
196
-
197
-
198
-
199
-
200
-
201
-
202
-
203
-
204
-
205
-
206
-
207
-
208
-
209
-
210
-
211
-
212
-
213
-
214
-
215
-
216
-
217
-
218
-
219
-
220
-
221
-
222
-
223
-
224
-
225
-
226
-
227
-
228
-
229
-
230
-
231
-
232
-
233
-
234
-
235
-
236
-
237
-
238
-
239
-
240
-
241
-
242
-
243
-
244
-
245
-
246
-
247
-
248
-
249
-
250
-
251
-
252
-
253
-
254
-
255
-
256
-
257
-
258
-
259
-
260
-
261
-
262
-
263
-
264
-
265
-
266
-
267
-
268
-
269
-
270
-
271
-
272
-
273
-
274
-
275
-
276
-
277
-
278
-
279
-
280
-
281
-
282
-
283
-
284
 |
 |

80 Bank of America 2012
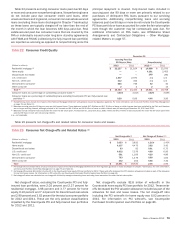
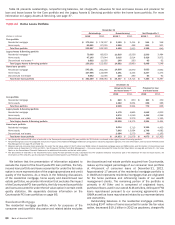
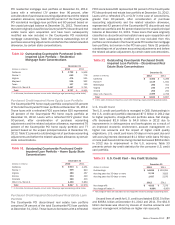
Table 24 presents outstandings, nonperforming balances, net charge-offs, allowance for loan and lease losses and provision for
loan and lease losses for the Core portfolio and the Legacy Assets & Servicing portfolio within the home loans portfolio. For more
information on Legacy Assets & Servicing, see page 37.
Table 24 Home Loans Portfolio
December 31
Outstandings Nonperforming Net Charge-offs (1)
(Dollars in millions) 2012 2011 2012 (2) 2011 2012 (2) 2011
Core portfolio
Residential mortgage $ 170,116 $178,337 $ 3,190 $ 2,414 $544 $ 348
Home equity 60,851 67,055 1,265 439 811 501
Total Core portfolio 230,967 245,392 4,455 2,853 1,355 849
Legacy Assets & Servicing portfolio
Residential mortgage (3) 73,065 83,953 11,618 13,556 2,509 3,484
Home equity 47,145 57,644 3,016 2,014 3,426 3,972
Discontinued real estate (3) 9,892 11,095 248 290 63 92
Total Legacy Assets & Servicing portfolio 130,102 152,692 14,882 15,860 5,998 7,548
Home loans portfolio
Residential mortgage 243,181 262,290 14,808 15,970 3,053 3,832
Home equity 107,996 124,699 4,281 2,453 4,237 4,473
Discontinued real estate 9,892 11,095 248 290 63 92
Total home loans portfolio $ 361,069 $398,084 $ 19,337 $ 18,713 $ 7,353 $ 8,397
December 31
Allowance for loan
and lease losses (4)
Provision for loan
and lease losses
2012 2011 2012 2011
Core portfolio
Residential mortgage $829 $ 850 $523 $ 450
Home equity 1,269 2,054 256 386
Total Core portfolio 2,098 2,904 779 836
Legacy Assets & Servicing portfolio
Residential mortgage 4,175 4,865 1,842 4,003
Home equity 6,576 11,040 1,492 4,296
Discontinued real estate 2,084 2,270 (40) 1,165
Total Legacy Assets & Servicing portfolio 12,835 18,175 3,294 9,464
Home loans portfolio
Residential mortgage 5,004 5,715 2,365 4,453
Home equity 7,845 13,094 1,748 4,682
Discontinued real estate 2,084 2,270 (40) 1,165
Total home loans portfolio $ 14,933 $ 21,079 $ 4,073 $ 10,300
(1) Net charge-offs exclude $2.8 billion of write-offs in the Countrywide home equity PCI loan portfolio for 2012 which is included in the Legacy Assets & Servicing portfolio.
(2) Nonperforming loans and net charge-offs include the impacts of the National Mortgage Settlement and guidance issued by regulatory agencies. For more information, see Consumer Portfolio Credit
Risk Management on page 76 and Table 21.
(3) Balances exclude consumer loans accounted for under the fair value option of $147 million and $906 million of residential mortgage loans and $858 million and $1.3 billion of discontinued real
estate loans at December 31, 2012 and 2011. See Consumer Portfolio Credit Risk Management – Consumer Loans Accounted for Under the Fair Value Option on page 89 and Note 22 – Fair Value
Option to the Consolidated Financial Statements for additional information on the fair value option.
(4) The $2.8 billion of write-offs in the Countrywide home equity PCI loan portfolio for 2012 decreased the PCI valuation allowance included as part of the allowance for loan and lease losses. For
information on PCI write-offs, see Countrywide Purchased Credit-impaired Loan Portfolio on page 86.
We believe that the presentation of information adjusted to
exclude the impact of the Countrywide PCI loan portfolio, the fully-
insured loan portfolio and loans accounted for under the fair value
option is more representative of the ongoing operations and credit
quality of the business. As a result, in the following discussions
of the residential mortgage, home equity and discontinued real
estate portfolios, we provide information that excludes the impact
of the Countrywide PCI loan portfolio, the fully-insured loan portfolio
and loans accounted for under the fair value option in certain credit
quality statistics. We separately disclose information on the
Countrywide PCI loan portfolios on page 86.
Residential Mortgage
The residential mortgage portfolio, which for purposes of the
consumer credit portfolio discussion and related tables excludes
the discontinued real estate portfolio acquired from Countrywide,
makes up the largest percentage of our consumer loan portfolio
at 44 percent of consumer loans at December 31, 2012.
Approximately 17 percent of the residential mortgage portfolio is
in GWIM and represents residential mortgages that are originated
for the home purchase and refinancing needs of our wealth
management clients. The remaining portion of the portfolio is
primarily in All Other and is comprised of originated loans,
purchased loans used in our overall ALM activities, delinquent FHA
loans repurchased pursuant to our servicing agreements with
GNMA as well as loans repurchased related to our representations
and warranties.
Outstanding balances in the residential mortgage portfolio,
excluding $147 million of loans accounted for under the fair value
option, decreased $19.1 billion in 2012 as paydowns, charge-offs