Bank of America 2012 Annual Report Download - page 116
Download and view the complete annual report
Please find page 116 of the 2012 Bank of America annual report below. You can navigate through the pages in the report by either clicking on the pages listed below, or by using the keyword search tool below to find specific information within the annual report.-
 1
1 -
2
-
3
-
4
-
5
-
6
-
7
-
8
-
9
-
10
-
11
-
12
-
13
-
14
-
15
-
16
-
17
-
18
-
19
-
20
-
21
-
22
-
23
-
24
-
25
-
26
-
27
-
28
-
29
-
30
-
31
-
32
-
33
-
34
-
35
-
36
-
37
-
38
-
39
-
40
-
41
-
42
-
43
-
44
-
45
-
46
-
47
-
48
-
49
-
50
-
51
-
52
-
53
-
54
-
55
-
56
-
57
-
58
-
59
-
60
-
61
-
62
-
63
-
64
-
65
-
66
-
67
-
68
-
69
-
70
-
71
-
72
-
73
-
74
-
75
-
76
-
77
-
78
-
79
-
80
-
81
-
82
-
83
-
84
-
85
-
86
-
87
-
88
-
89
-
90
-
91
-
92
-
93
-
94
-
95
-
96
-
97
-
98
-
99
-
100
-
101
-
102
-
103
-
104
-
105
-
 106
106 -
 107
107 -
 108
108 -
 109
109 -
 110
110 -
 111
111 -
 112
112 -
 113
113 -
 114
114 -
 115
115 -
 116
116 -
 117
117 -
 118
118 -
 119
119 -
 120
120 -
 121
121 -
 122
122 -
 123
123 -
 124
124 -
 125
125 -
 126
126 -
127
-
128
-
129
-
130
-
131
-
132
-
133
-
134
-
135
-
136
-
137
-
138
-
139
-
140
-
141
-
142
-
143
-
144
-
145
-
146
-
147
-
148
-
149
-
150
-
151
-
152
-
153
-
154
-
155
-
156
-
157
-
158
-
159
-
160
-
161
-
162
-
163
-
164
-
165
-
166
-
167
-
168
-
169
-
170
-
171
-
172
-
173
-
174
-
175
-
176
-
177
-
178
-
179
-
180
-
181
-
182
-
183
-
184
-
185
-
186
-
187
-
188
-
189
-
190
-
191
-
192
-
193
-
194
-
195
-
196
-
197
-
198
-
199
-
200
-
201
-
202
-
203
-
204
-
205
-
206
-
207
-
208
-
209
-
210
-
211
-
212
-
213
-
214
-
215
-
216
-
217
-
218
-
219
-
220
-
221
-
222
-
223
-
224
-
225
-
226
-
227
-
228
-
229
-
230
-
231
-
232
-
233
-
234
-
235
-
236
-
237
-
238
-
239
-
240
-
241
-
242
-
243
-
244
-
245
-
246
-
247
-
248
-
249
-
250
-
251
-
252
-
253
-
254
-
255
-
256
-
257
-
258
-
259
-
260
-
261
-
262
-
263
-
264
-
265
-
266
-
267
-
268
-
269
-
270
-
271
-
272
-
273
-
274
-
275
-
276
-
277
-
278
-
279
-
280
-
281
-
282
-
283
-
284
 |
 |

114 Bank of America 2012
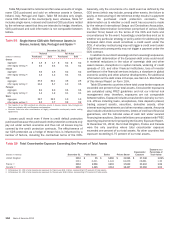
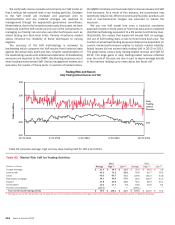
Table 64 shows the pre-tax dollar impact to forecasted net
interest income over the next 12 months from December 31, 2012
and 2011, resulting from instantaneous parallel and non-parallel
shocks to the market-based forward curve. Periodically we evaluate
the scenarios presented to ensure that they are meaningful in the
context of the current rate environment. For more information, see
Net Interest Income Excluding Trading-related Net Interest Income
on page 32.
Table 64 Estimated Net Interest Income Excluding
Trading-related Net Interest Income
(Dollars in millions) Short
Rate (bps)
Long
Rate (bps)
December 31
Curve Change 2012 2011
Parallel Shifts
+100 bps
instantaneous shift +100 +100 $ 4,232 $ 2,883
-50 bps
instantaneous shift -50 -50 (2,250) (1,795)
Flatteners
Short end
instantaneous change +100 — 2,159 979
Long end
instantaneous change — -50 (1,597) (1,319)
Steepeners
Short end
instantaneous change -50 — (655) (464)
Long end
instantaneous change — +100 2,091 1,935
The sensitivity analysis in Table 64 assumes that we take no
action in response to these rate shocks. Our net interest income
was asset sensitive to a parallel move in interest rates at both
December 31, 2012 and 2011. As part of our ALM activities, we
use securities, residential mortgages, and interest rate and foreign
exchange derivatives in managing interest rate sensitivity.
Securities
The securities portfolio is an integral part of our ALM positioning
and is primarily comprised of debt securities including MBS and
to a lesser extent U.S. Treasury, corporate, municipal and other
debt securities. At December 31, 2012 and 2011, we held AFS
debt securities with a fair value of $286.9 billion and $276.2
billion. During 2012 and 2011, we purchased AFS debt and other
securities of $164.5 billion and $99.5 billion, sold $72.4 billion
and $116.8 billion, and had maturities and received paydowns of
$71.5 billion and $56.7 billion. We realized $1.7 billion and $3.4
billion in net gains on sales of debt securities during 2012 and
2011. At December 31, 2012 and 2011, we held $49.5 billion
and $35.3 billion of held-to-maturity securities and $14.5 billion
of other securities classified as other assets. There were no
securities classified as other assets during 2011.
Accumulated OCI included after-tax net unrealized gains of $4.4
billion and $3.1 billion on AFS debt securities and $462 million
and $3 million on AFS marketable equity securities at December
31, 2012 and 2011. For additional information on accumulated
OCI, see Note 15 – Accumulated Other Comprehensive Income
(Loss) to the Consolidated Financial Statements. The amount of
pre-tax net unrealized gains on AFS debt securities increased $2.1
billion during 2012 to $7.0 billion, primarily due to the impact of
lower rates. For additional information on our securities portfolio,
see Note 4 – Securities to the Consolidated Financial Statements.
We recognized $53 million of other-than-temporary impairment
(OTTI) losses in earnings on AFS debt securities in 2012 compared
to $299 million in 2011. The recognition of OTTI is based on a
variety of factors, including the length of time and extent to which
the market value has been less than amortized cost, the financial
condition of the issuer of the security including credit ratings and
any specific events affecting the operations of the issuer,
underlying assets that collateralize the debt security, other industry
and macroeconomic conditions, and our intent and ability to hold
the security to recovery.
Residential Mortgage Portfolio
At December 31, 2012 and 2011, our residential mortgage
portfolio was $243.2 billion and $262.3 billion which excluded
$9.9 billion and $11.1 billion of discontinued real estate loans
and $1.0 billion and $2.2 billion of consumer loans accounted for
under the fair value option. For more information on consumer fair
value option loans, see Consumer Portfolio Credit Risk
Management – Consumer Loans Accounted for Under the Fair
Value Option on page 89. The $19.1 billion decrease in 2012 was
due to paydowns, charge-offs and transfers to foreclosed
properties which more than offset new origination volume and
repurchases of delinquent FHA loans pursuant to our servicing
agreements with GNMA.
During 2012, CRES and GWIM originated $35.4 billion in first-
lien mortgages that we retained compared to $45.5 billion in 2011.
Additionally, we repurchased $8.2 billion of delinquent FHA loans
pursuant to our servicing agreements with GNMA compared to
repurchases of $7.8 billion in 2011. We received paydowns of
$53.0 billion in 2012 compared to paydowns of $42.3 billion in
2011. There were no purchases of residential mortgages related
to ALM activities in 2012 compared to $72 million in 2011. We
sold $305 million of residential mortgages in 2012 compared to
$109 million in 2011, all of which were originated residential
mortgages. Gains recognized on the sales of residential
mortgages in both periods were minimal.
Interest Rate and Foreign Exchange Derivative
Contracts
Interest rate and foreign exchange derivative contracts are utilized
in our ALM activities and serve as an efficient tool to manage our
interest rate and foreign exchange risk. We use derivatives to
hedge the variability in cash flows or changes in fair value on our
balance sheet due to interest rate and foreign exchange
components. For additional information on our hedging activities,
see Note 3 – Derivatives to the Consolidated Financial Statements.
Our interest rate contracts are generally non-leveraged generic
interest rate and foreign exchange basis swaps, options, futures
and forwards. In addition, we use foreign exchange contracts,
including cross-currency interest rate swaps, foreign currency
forward contracts and options to mitigate the foreign exchange
risk associated with foreign currency-denominated assets and
liabilities.
Changes to the composition of our derivatives portfolio during
2012 reflect actions taken for interest rate and foreign exchange
rate risk management. The decisions to reposition our derivatives
portfolio are based on the current assessment of economic and
financial conditions including the interest rate and foreign currency
environments, balance sheet composition and trends, the asset
sensitivity of our balance sheet and the relative mix of our cash
and derivative positions.