Bank of America 2012 Annual Report Download - page 41
Download and view the complete annual report
Please find page 41 of the 2012 Bank of America annual report below. You can navigate through the pages in the report by either clicking on the pages listed below, or by using the keyword search tool below to find specific information within the annual report.-
 1
1 -
2
-
3
-
4
-
5
-
6
-
7
-
8
-
9
-
10
-
11
-
12
-
13
-
14
-
15
-
16
-
17
-
18
-
19
-
20
-
21
-
22
-
23
-
24
-
25
-
26
-
27
-
28
-
29
-
30
-
 31
31 -
 32
32 -
 33
33 -
 34
34 -
 35
35 -
 36
36 -
 37
37 -
 38
38 -
 39
39 -
 40
40 -
 41
41 -
 42
42 -
 43
43 -
 44
44 -
 45
45 -
 46
46 -
 47
47 -
 48
48 -
 49
49 -
 50
50 -
 51
51 -
52
-
53
-
54
-
55
-
56
-
57
-
58
-
59
-
60
-
61
-
62
-
63
-
64
-
65
-
66
-
67
-
68
-
69
-
70
-
71
-
72
-
73
-
74
-
75
-
76
-
77
-
78
-
79
-
80
-
81
-
82
-
83
-
84
-
85
-
86
-
87
-
88
-
89
-
90
-
91
-
92
-
93
-
94
-
95
-
96
-
97
-
98
-
99
-
100
-
101
-
102
-
103
-
104
-
105
-
106
-
107
-
108
-
109
-
110
-
111
-
112
-
113
-
114
-
115
-
116
-
117
-
118
-
119
-
120
-
121
-
122
-
123
-
124
-
125
-
126
-
127
-
128
-
129
-
130
-
131
-
132
-
133
-
134
-
135
-
136
-
137
-
138
-
139
-
140
-
141
-
142
-
143
-
144
-
145
-
146
-
147
-
148
-
149
-
150
-
151
-
152
-
153
-
154
-
155
-
156
-
157
-
158
-
159
-
160
-
161
-
162
-
163
-
164
-
165
-
166
-
167
-
168
-
169
-
170
-
171
-
172
-
173
-
174
-
175
-
176
-
177
-
178
-
179
-
180
-
181
-
182
-
183
-
184
-
185
-
186
-
187
-
188
-
189
-
190
-
191
-
192
-
193
-
194
-
195
-
196
-
197
-
198
-
199
-
200
-
201
-
202
-
203
-
204
-
205
-
206
-
207
-
208
-
209
-
210
-
211
-
212
-
213
-
214
-
215
-
216
-
217
-
218
-
219
-
220
-
221
-
222
-
223
-
224
-
225
-
226
-
227
-
228
-
229
-
230
-
231
-
232
-
233
-
234
-
235
-
236
-
237
-
238
-
239
-
240
-
241
-
242
-
243
-
244
-
245
-
246
-
247
-
248
-
249
-
250
-
251
-
252
-
253
-
254
-
255
-
256
-
257
-
258
-
259
-
260
-
261
-
262
-
263
-
264
-
265
-
266
-
267
-
268
-
269
-
270
-
271
-
272
-
273
-
274
-
275
-
276
-
277
-
278
-
279
-
280
-
281
-
282
-
283
-
284
 |
 |

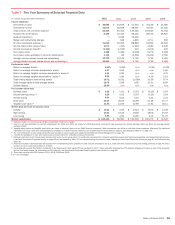
Bank of America 2012 39
Legacy Portfolios
The Legacy Portfolios (both owned and serviced) include those
loans that would not have been originated under our underwriting
standards at December 31, 2010. The Countrywide PCI portfolio
as well as certain loans that met a pre-defined delinquency status
or probability of default threshold as of January 1, 2011 are also
included in the Legacy Portfolios. Since determining the pool of
loans to be included in the Legacy Portfolios as of January 1, 2011,
the criteria have not changed for these portfolios, but will continue
to be evaluated over time.
Legacy Owned Portfolio
The Legacy Owned Portfolio includes those loans that met the
criteria as described above and are on the balance sheet of the
Corporation. The home equity loan portfolio is held on the balance
sheet of Legacy Assets & Servicing; whereas, the residential
mortgage and discontinued real estate loan portfolios are held on
the balance sheet of All Other. The financial results of the on-
balance sheet loans are reported in the segment that owns the
loans or in All Other. During 2012, the total loans in the Legacy
Owned Portfolio decreased $23.8 billion to $131.1 billion at
December 31, 2012, of which $48.2 billion was reflected on the
Legacy Assets & Servicing balance sheet and the remainder was
held on the balance sheet of All Other. The decline was primarily
related to paydowns and payoffs, but also reflects forgiveness of
loans in connection with the National Mortgage Settlement, and
charge-offs recorded on loans discharged in Chapter 7 bankruptcy
under new regulatory guidance implemented during 2012. For
more information on the National Mortgage Settlement and the
new regulatory guidance, see Consumer Portfolio Credit Risk
Management on page 76.
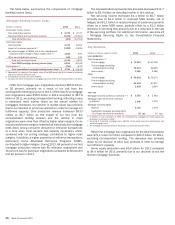
Legacy Serviced Portfolio
The Legacy Serviced Portfolio includes the Legacy Owned Portfolio
and those loans serviced for outside investors that met the criteria
as described above. The following table summarizes the balances
of the residential mortgage and discontinued real estate loans
included in the Legacy Serviced Portfolio (collectively, the Legacy
Residential Mortgage Serviced Portfolio) representing 39 percent,
41 percent and 48 percent of the total residential mortgage
serviced portfolio, as measured by unpaid principal balance, of
$1.2 trillion, $1.6 trillion and $1.9 trillion at December 31, 2012,
2011 and 2010, respectively. The decline in the Legacy Residential
Mortgage Serviced Portfolio was primarily related to servicing
transfers, paydowns and payoffs.
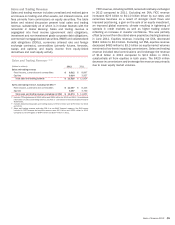
Legacy Residential Mortgage Serviced Portfolio, a subset
of the Residential Mortgage Serviced Portfolio (1)
December 31
(Dollars in billions) 2012 2011 2010
Unpaid principal balance
Residential mortgage loans (2)
Total $ 467 $ 659 $ 912
60 days or more past due 137 235 312
Number of loans serviced (in thousands)
Residential mortgage loans (2)
Total 2,542 3,440 4,660
60 days or more past due 649 1,061 1,373
(1) Excludes $57 billion, $84 billion and $99 billion of home equity loans and HELOCs at
December 31, 2012, 2011 and 2010, respectively.
(2) Includes discontinued real estate loans.
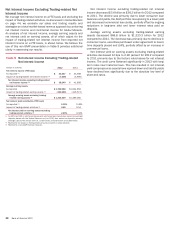
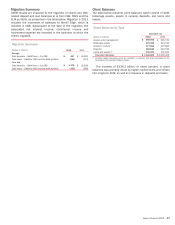
Non-Legacy Portfolio
As discussed above, Legacy Assets & Servicing is responsible for
all of our servicing activities. The following table summarizes the
balances of the residential mortgage and discontinued real estate
loans that are not included in the Legacy Serviced Portfolio (the
Non-Legacy Residential Mortgage Serviced Portfolio) representing
61 percent, 59 percent and 52 percent of the total residential
mortgage serviced portfolio, as measured by unpaid principal
balance, at December 31, 2012, 2011 and 2010, respectively.
The decline in the Non-Legacy Residential Mortgage Serviced
Portfolio was primarily related to servicing transfers, paydowns
and payoffs.
Non-Legacy Residential Mortgage Serviced Portfolio, a
subset of the Residential Mortgage Serviced Portfolio (1)
December 31
(Dollars in billions) 2012 2011 2010
Unpaid principal balance
Residential mortgage loans (2)
Total $ 744 $ 953 $ 977
60 days or more past due 22 17 1
Number of loans serviced (in thousands)
Residential mortgage loans (2)
Total 4,764 5,731 5,773
60 days or more past due 124 95 —
(1) Excludes $64 billion, $67 billion and $69 billion of home equity loans and HELOCs at
December 31, 2012, 2011 and 2010, respectively.
(2) Includes discontinued real estate loans.
Mortgage Banking Income
CRES mortgage banking income (loss) is categorized into
production and servicing income. Core production income is
comprised of revenue from the fair value gains and losses
recognized on our interest rate lock commitments (IRLCs) and
LHFS, the related secondary market execution, and costs related
to representations and warranties in the sales transactions along
with other obligations incurred in the sales of mortgage loans.
Ongoing costs related to representations and warranties and other
obligations that were incurred in the sales of mortgage loans in
prior periods are also included in production income.
Servicing income includes income earned in connection with
servicing activities and MSR valuation adjustments, net of results
from risk management activities used to hedge certain market
risks of the MSRs. The costs associated with our servicing
activities are included in noninterest expense.