Bank of America 2012 Annual Report Download - page 154
Download and view the complete annual report
Please find page 154 of the 2012 Bank of America annual report below. You can navigate through the pages in the report by either clicking on the pages listed below, or by using the keyword search tool below to find specific information within the annual report.-
 1
1 -
2
-
3
-
4
-
5
-
6
-
7
-
8
-
9
-
10
-
11
-
12
-
13
-
14
-
15
-
16
-
17
-
18
-
19
-
20
-
21
-
22
-
23
-
24
-
25
-
26
-
27
-
28
-
29
-
30
-
31
-
32
-
33
-
34
-
35
-
36
-
37
-
38
-
39
-
40
-
41
-
42
-
43
-
44
-
45
-
46
-
47
-
48
-
49
-
50
-
51
-
52
-
53
-
54
-
55
-
56
-
57
-
58
-
59
-
60
-
61
-
62
-
63
-
64
-
65
-
66
-
67
-
68
-
69
-
70
-
71
-
72
-
73
-
74
-
75
-
76
-
77
-
78
-
79
-
80
-
81
-
82
-
83
-
84
-
85
-
86
-
87
-
88
-
89
-
90
-
91
-
92
-
93
-
94
-
95
-
96
-
97
-
98
-
99
-
100
-
101
-
102
-
103
-
104
-
105
-
106
-
107
-
108
-
109
-
110
-
111
-
112
-
113
-
114
-
115
-
116
-
117
-
118
-
119
-
120
-
121
-
122
-
123
-
124
-
125
-
126
-
127
-
128
-
129
-
130
-
131
-
132
-
133
-
134
-
135
-
136
-
137
-
138
-
139
-
140
-
141
-
142
-
143
-
 144
144 -
 145
145 -
 146
146 -
 147
147 -
 148
148 -
 149
149 -
 150
150 -
 151
151 -
 152
152 -
 153
153 -
 154
154 -
 155
155 -
 156
156 -
 157
157 -
 158
158 -
 159
159 -
 160
160 -
 161
161 -
 162
162 -
 163
163 -
 164
164 -
165
-
166
-
167
-
168
-
169
-
170
-
171
-
172
-
173
-
174
-
175
-
176
-
177
-
178
-
179
-
180
-
181
-
182
-
183
-
184
-
185
-
186
-
187
-
188
-
189
-
190
-
191
-
192
-
193
-
194
-
195
-
196
-
197
-
198
-
199
-
200
-
201
-
202
-
203
-
204
-
205
-
206
-
207
-
208
-
209
-
210
-
211
-
212
-
213
-
214
-
215
-
216
-
217
-
218
-
219
-
220
-
221
-
222
-
223
-
224
-
225
-
226
-
227
-
228
-
229
-
230
-
231
-
232
-
233
-
234
-
235
-
236
-
237
-
238
-
239
-
240
-
241
-
242
-
243
-
244
-
245
-
246
-
247
-
248
-
249
-
250
-
251
-
252
-
253
-
254
-
255
-
256
-
257
-
258
-
259
-
260
-
261
-
262
-
263
-
264
-
265
-
266
-
267
-
268
-
269
-
270
-
271
-
272
-
273
-
274
-
275
-
276
-
277
-
278
-
279
-
280
-
281
-
282
-
283
-
284
 |
 |

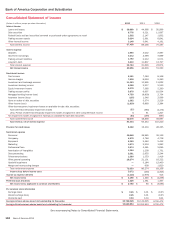
152 Bank of America 2012
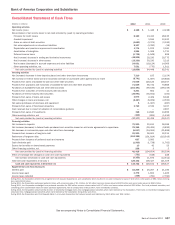
Bank of America Corporation and Subsidiaries
Consolidated Statement of Income
(Dollars in millions, except per share information) 2012 2011 2010
Interest income
Loans and leases $ 38,880 $ 44,966 $ 50,996
Debt securities 8,776 9,521 11,667
Federal funds sold and securities borrowed or purchased under agreements to resell 1,502 2,147 1,832
Trading account assets 5,094 5,961 6,841
Other interest income 3,148 3,641 4,161
Total interest income 57,400 66,236 75,497
Interest expense
Deposits 1,990 3,002 3,997
Short-term borrowings 3,572 4,599 3,699
Trading account liabilities 1,763 2,212 2,571
Long-term debt 9,419 11,807 13,707
Total interest expense 16,744 21,620 23,974
Net interest income 40,656 44,616 51,523
Noninterest income
Card income 6,121 7,184 8,108
Service charges 7,600 8,094 9,390
Investment and brokerage services 11,393 11,826 11,622
Investment banking income 5,299 5,217 5,520
Equity investment income 2,070 7,360 5,260
Trading account profits 5,870 6,697 10,054
Mortgage banking income (loss) 4,750 (8,830) 2,734
Insurance income (loss) (195) 1,346 2,066
Gains on sales of debt securities 1,662 3,374 2,526
Other income (loss) (1,839)6,869 2,384
Other-than-temporary impairment losses on available-for-sale debt securities:
Total other-than-temporary impairment losses (57) (360) (2,174)
Less: Portion of other-than-temporary impairment losses recognized in other comprehensive income 461 1,207
Net impairment losses recognized in earnings on available-for-sale debt securities (53) (299) (967)
Total noninterest income 42,678 48,838 58,697
Total revenue, net of interest expense 83,334 93,454 110,220
Provision for credit losses 8,169 13,410 28,435
Noninterest expense
Personnel 35,648 36,965 35,149
Occupancy 4,570 4,748 4,716
Equipment 2,269 2,340 2,452
Marketing 1,873 2,203 1,963
Professional fees 3,574 3,381 2,695
Amortization of intangibles 1,264 1,509 1,731
Data processing 2,961 2,652 2,544
Telecommunications 1,660 1,553 1,416
Other general operating 18,274 21,101 16,222
Goodwill impairment —3,184 12,400
Merger and restructuring charges —638 1,820
Total noninterest expense 72,093 80,274 83,108
Income (loss) before income taxes 3,072 (230) (1,323)
Income tax expense (benefit) (1,116)(1,676) 915
Net income (loss) $ 4,188 $ 1,446 $ (2,238)
Preferred stock dividends 1,428 1,361 1,357
Net income (loss) applicable to common shareholders $ 2,760 $ 85 $ (3,595)
Per common share information
Earnings (loss) $0.26 $ 0.01 $ (0.37)
Diluted earnings (loss) 0.25 0.01 (0.37)
Dividends paid 0.04 0.04 0.04
Average common shares issued and outstanding (in thousands) 10,746,028 10,142,625 9,790,472
Average diluted common shares issued and outstanding (in thousands) 10,840,854 10,254,824 9,790,472
See accompanying Notes to Consolidated Financial Statements.