Bank of America 2012 Annual Report Download - page 218
Download and view the complete annual report
Please find page 218 of the 2012 Bank of America annual report below. You can navigate through the pages in the report by either clicking on the pages listed below, or by using the keyword search tool below to find specific information within the annual report.-
 1
1 -
2
-
3
-
4
-
5
-
6
-
7
-
8
-
9
-
10
-
11
-
12
-
13
-
14
-
15
-
16
-
17
-
18
-
19
-
20
-
21
-
22
-
23
-
24
-
25
-
26
-
27
-
28
-
29
-
30
-
31
-
32
-
33
-
34
-
35
-
36
-
37
-
38
-
39
-
40
-
41
-
42
-
43
-
44
-
45
-
46
-
47
-
48
-
49
-
50
-
51
-
52
-
53
-
54
-
55
-
56
-
57
-
58
-
59
-
60
-
61
-
62
-
63
-
64
-
65
-
66
-
67
-
68
-
69
-
70
-
71
-
72
-
73
-
74
-
75
-
76
-
77
-
78
-
79
-
80
-
81
-
82
-
83
-
84
-
85
-
86
-
87
-
88
-
89
-
90
-
91
-
92
-
93
-
94
-
95
-
96
-
97
-
98
-
99
-
100
-
101
-
102
-
103
-
104
-
105
-
106
-
107
-
108
-
109
-
110
-
111
-
112
-
113
-
114
-
115
-
116
-
117
-
118
-
119
-
120
-
121
-
122
-
123
-
124
-
125
-
126
-
127
-
128
-
129
-
130
-
131
-
132
-
133
-
134
-
135
-
136
-
137
-
138
-
139
-
140
-
141
-
142
-
143
-
144
-
145
-
146
-
147
-
148
-
149
-
150
-
151
-
152
-
153
-
154
-
155
-
156
-
157
-
158
-
159
-
160
-
161
-
162
-
163
-
164
-
165
-
166
-
167
-
168
-
169
-
170
-
171
-
172
-
173
-
174
-
175
-
176
-
177
-
178
-
179
-
180
-
181
-
182
-
183
-
184
-
185
-
186
-
187
-
188
-
189
-
190
-
191
-
192
-
193
-
194
-
195
-
196
-
197
-
198
-
199
-
200
-
201
-
202
-
203
-
204
-
205
-
206
-
207
-
 208
208 -
 209
209 -
 210
210 -
 211
211 -
 212
212 -
 213
213 -
 214
214 -
 215
215 -
 216
216 -
 217
217 -
 218
218 -
 219
219 -
 220
220 -
 221
221 -
 222
222 -
 223
223 -
 224
224 -
 225
225 -
 226
226 -
 227
227 -
 228
228 -
229
-
230
-
231
-
232
-
233
-
234
-
235
-
236
-
237
-
238
-
239
-
240
-
241
-
242
-
243
-
244
-
245
-
246
-
247
-
248
-
249
-
250
-
251
-
252
-
253
-
254
-
255
-
256
-
257
-
258
-
259
-
260
-
261
-
262
-
263
-
264
-
265
-
266
-
267
-
268
-
269
-
270
-
271
-
272
-
273
-
274
-
275
-
276
-
277
-
278
-
279
-
280
-
281
-
282
-
283
-
284
 |
 |

216 Bank of America 2012
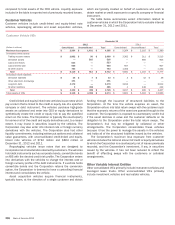
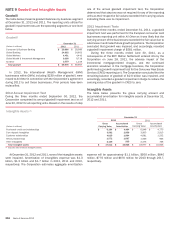
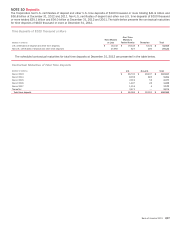
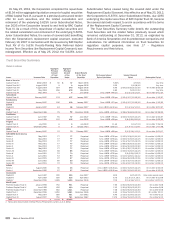
NOTE 9 Goodwill and Intangible Assets
Goodwill
The table below presents goodwill balances by business segment
at December 31, 2012 and 2011. The reporting units utilized for
goodwill impairment tests are the operating segments or one level
below.
Goodwill
December 31
(Dollars in millions) 2012 2011
Consumer & Business Banking $ 29,986 $ 29,986
Global Banking 24,802 24,802
Global Markets 4,451 4,442
Global Wealth & Investment Management 9,698 9,718
All Other 1,039 1,019
Total goodwill $ 69,976 $ 69,967
In 2012, the International Wealth Management (IWM)
businesses within GWIM, including $230 million of goodwill, were
moved to All Other in connection with the Corporation’s agreement
during 2012 to sell these businesses. Prior periods have been
reclassified.
2012 Annual Impairment Test
During the three months ended September 30, 2012, the
Corporation completed its annual goodwill impairment test as of
June 30, 2012 for all reporting units. Based on the results of step
one of the annual goodwill impairment test, the Corporation
determined that step two was not required for any of the reporting
units as their respective fair values exceeded their carrying values
indicating there was no impairment.
2011 Impairment Tests
During the three months ended December 31, 2011, a goodwill
impairment test was performed for the European consumer card
businesses reporting unit within All Other as it was likely that the
carrying amount of the businesses exceeded the fair value due to
a decrease in estimated future growth projections. The Corporation
concluded that goodwill was impaired, and accordingly, recorded
a goodwill impairment charge of $581 million.
During the three months ended June 30, 2011, as a
consequence of the BNY Mellon Settlement entered into by the
Corporation on June 28, 2011, the adverse impact of the
incremental mortgage-related charges, and the continued
economic slowdown in the mortgage business, the Corporation
performed a goodwill impairment test for the Consumer Real Estate
Services (CRES) reporting unit. The Corporation concluded that the
remaining balance of goodwill of $2.6 billion was impaired, and
accordingly, recorded a goodwill impairment charge to reduce the
carrying value of the goodwill in CRES to zero.
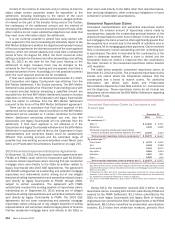
Intangible Assets
The table below presents the gross carrying amount and
accumulated amortization for intangible assets at December 31,
2012 and 2011.
Intangible Assets (1)
December 31
2012 2011
(Dollars in millions)
Gross
Carrying Value
Accumulated
Amortization
Gross
Carrying Value
Accumulated
Amortization
Purchased credit card relationships $ 6,184 $ 4,494 $ 6,948 $ 4,775
Core deposit intangibles 3,592 2,858 3,903 2,915
Customer relationships 4,025 1,884 4,081 1,532
Affinity relationships 1,572 1,087 1,569 966
Other intangibles 2,139 505 2,476 768
Total intangible assets $ 17,512 $ 10,828 $ 18,977 $ 10,956
(1) Excludes fully amortized intangible assets.
At December 31, 2012 and 2011, none of the intangible assets
were impaired. Amortization of intangibles expense was $1.3
billion, $1.5 billion and $1.7 billion in 2012, 2011 and 2010,
respectively. The Corporation estimates aggregate amortization
expense will be approximately $1.1 billion, $950 million, $840
million, $770 million and $670 million for 2013 through 2017,
respectively.