Bank of America 2012 Annual Report Download - page 80
Download and view the complete annual report
Please find page 80 of the 2012 Bank of America annual report below. You can navigate through the pages in the report by either clicking on the pages listed below, or by using the keyword search tool below to find specific information within the annual report.-
 1
1 -
2
-
3
-
4
-
5
-
6
-
7
-
8
-
9
-
10
-
11
-
12
-
13
-
14
-
15
-
16
-
17
-
18
-
19
-
20
-
21
-
22
-
23
-
24
-
25
-
26
-
27
-
28
-
29
-
30
-
31
-
32
-
33
-
34
-
35
-
36
-
37
-
38
-
39
-
40
-
41
-
42
-
43
-
44
-
45
-
46
-
47
-
48
-
49
-
50
-
51
-
52
-
53
-
54
-
55
-
56
-
57
-
58
-
59
-
60
-
61
-
62
-
63
-
64
-
65
-
66
-
67
-
68
-
69
-
 70
70 -
 71
71 -
 72
72 -
 73
73 -
 74
74 -
 75
75 -
 76
76 -
 77
77 -
 78
78 -
 79
79 -
 80
80 -
 81
81 -
 82
82 -
 83
83 -
 84
84 -
 85
85 -
 86
86 -
 87
87 -
 88
88 -
 89
89 -
 90
90 -
91
-
92
-
93
-
94
-
95
-
96
-
97
-
98
-
99
-
100
-
101
-
102
-
103
-
104
-
105
-
106
-
107
-
108
-
109
-
110
-
111
-
112
-
113
-
114
-
115
-
116
-
117
-
118
-
119
-
120
-
121
-
122
-
123
-
124
-
125
-
126
-
127
-
128
-
129
-
130
-
131
-
132
-
133
-
134
-
135
-
136
-
137
-
138
-
139
-
140
-
141
-
142
-
143
-
144
-
145
-
146
-
147
-
148
-
149
-
150
-
151
-
152
-
153
-
154
-
155
-
156
-
157
-
158
-
159
-
160
-
161
-
162
-
163
-
164
-
165
-
166
-
167
-
168
-
169
-
170
-
171
-
172
-
173
-
174
-
175
-
176
-
177
-
178
-
179
-
180
-
181
-
182
-
183
-
184
-
185
-
186
-
187
-
188
-
189
-
190
-
191
-
192
-
193
-
194
-
195
-
196
-
197
-
198
-
199
-
200
-
201
-
202
-
203
-
204
-
205
-
206
-
207
-
208
-
209
-
210
-
211
-
212
-
213
-
214
-
215
-
216
-
217
-
218
-
219
-
220
-
221
-
222
-
223
-
224
-
225
-
226
-
227
-
228
-
229
-
230
-
231
-
232
-
233
-
234
-
235
-
236
-
237
-
238
-
239
-
240
-
241
-
242
-
243
-
244
-
245
-
246
-
247
-
248
-
249
-
250
-
251
-
252
-
253
-
254
-
255
-
256
-
257
-
258
-
259
-
260
-
261
-
262
-
263
-
264
-
265
-
266
-
267
-
268
-
269
-
270
-
271
-
272
-
273
-
274
-
275
-
276
-
277
-
278
-
279
-
280
-
281
-
282
-
283
-
284
 |
 |

78 Bank of America 2012
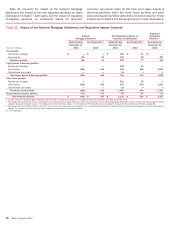
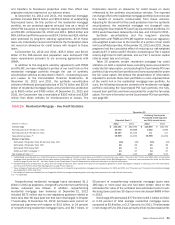
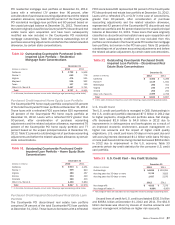
Table 21 presents the impact of the National Mortgage
Settlement, the impact of the new regulatory guidance on loans
discharged in Chapter 7 bankruptcy and the impact of regulatory
interagency guidance on nonaccrual status for junior-lien
consumer real estate loans for the Core and Legacy Assets &
Servicing portfolios within the home loans portfolio and other
secured consumer portfolio within direct/indirect consumer. These
impacts are included in the following consumer credit discussions.
Table 21 Impact of the National Mortgage Settlement and Regulatory Agency Guidance
National
Mortgage Settlement
New Regulatory Guidance on
Treatment of Bankruptcies
Regulatory
Interagency
Guidance (1)
Nonperforming Net Charge-offs (2) Nonperforming Net Charge-offs (3) Nonperforming
(Dollars in millions)
December 31
2012 2012
December 31
2012 2012
December 31
2012
Core portfolio
Residential mortgage $—$ —$ 190 $11 $—
Home equity (91) 91 170 66 457
Total Core portfolio (91) 91 360 77 457
Legacy Assets & Servicing portfolio
Residential mortgage ——
382 64 —
Home equity (344) 344 308 408 1,000
Discontinued real estate — — 14 ——
Total Legacy Assets & Servicing portfolio (344) 344 704 472 1,000
Home loans portfolio
Residential mortgage ——
572 75 —
Home equity (435) 435 478 474 1,457
Discontinued real estate — — 14 ——
Total home loans portfolio (435) 435 1,064 549 1,457
Direct/Indirect consumer portfolio n/a n/a 58 47 n/a
Total consumer portfolio $ (435) $ 435 $ 1,122 $ 596 $ 1,457
(1) In 2012, the bank regulatory agencies jointly issued interagency supervisory guidance on nonaccrual status for junior-lien consumer real estate loans.
(2) Net charge-offs exclude $2.5 billion of write-offs in the Countrywide home equity PCI loan portfolio in connection with the National Mortgage Settlement in 2012. These write-offs decreased the PCI
valuation allowance included as part of the allowance for loan and lease losses. For information on PCI write-offs, see Countrywide Purchased Credit-impaired Loan Portfolio on page 86.
(3) Net charge-offs include $551 million of current or less than 60 days past due loans charged off as a result of the completion of implementation of new regulatory guidance on loans discharged in
Chapter 7 bankruptcy and $45 million of loans charged off subsequent to the implementation.
n/a = not applicable