Bank of America 2012 Annual Report Download - page 201
Download and view the complete annual report
Please find page 201 of the 2012 Bank of America annual report below. You can navigate through the pages in the report by either clicking on the pages listed below, or by using the keyword search tool below to find specific information within the annual report.-
 1
1 -
2
-
3
-
4
-
5
-
6
-
7
-
8
-
9
-
10
-
11
-
12
-
13
-
14
-
15
-
16
-
17
-
18
-
19
-
20
-
21
-
22
-
23
-
24
-
25
-
26
-
27
-
28
-
29
-
30
-
31
-
32
-
33
-
34
-
35
-
36
-
37
-
38
-
39
-
40
-
41
-
42
-
43
-
44
-
45
-
46
-
47
-
48
-
49
-
50
-
51
-
52
-
53
-
54
-
55
-
56
-
57
-
58
-
59
-
60
-
61
-
62
-
63
-
64
-
65
-
66
-
67
-
68
-
69
-
70
-
71
-
72
-
73
-
74
-
75
-
76
-
77
-
78
-
79
-
80
-
81
-
82
-
83
-
84
-
85
-
86
-
87
-
88
-
89
-
90
-
91
-
92
-
93
-
94
-
95
-
96
-
97
-
98
-
99
-
100
-
101
-
102
-
103
-
104
-
105
-
106
-
107
-
108
-
109
-
110
-
111
-
112
-
113
-
114
-
115
-
116
-
117
-
118
-
119
-
120
-
121
-
122
-
123
-
124
-
125
-
126
-
127
-
128
-
129
-
130
-
131
-
132
-
133
-
134
-
135
-
136
-
137
-
138
-
139
-
140
-
141
-
142
-
143
-
144
-
145
-
146
-
147
-
148
-
149
-
150
-
151
-
152
-
153
-
154
-
155
-
156
-
157
-
158
-
159
-
160
-
161
-
162
-
163
-
164
-
165
-
166
-
167
-
168
-
169
-
170
-
171
-
172
-
173
-
174
-
175
-
176
-
177
-
178
-
179
-
180
-
181
-
182
-
183
-
184
-
185
-
186
-
187
-
188
-
189
-
190
-
 191
191 -
 192
192 -
 193
193 -
 194
194 -
 195
195 -
 196
196 -
 197
197 -
 198
198 -
 199
199 -
 200
200 -
 201
201 -
 202
202 -
 203
203 -
 204
204 -
 205
205 -
 206
206 -
 207
207 -
 208
208 -
 209
209 -
 210
210 -
 211
211 -
212
-
213
-
214
-
215
-
216
-
217
-
218
-
219
-
220
-
221
-
222
-
223
-
224
-
225
-
226
-
227
-
228
-
229
-
230
-
231
-
232
-
233
-
234
-
235
-
236
-
237
-
238
-
239
-
240
-
241
-
242
-
243
-
244
-
245
-
246
-
247
-
248
-
249
-
250
-
251
-
252
-
253
-
254
-
255
-
256
-
257
-
258
-
259
-
260
-
261
-
262
-
263
-
264
-
265
-
266
-
267
-
268
-
269
-
270
-
271
-
272
-
273
-
274
-
275
-
276
-
277
-
278
-
279
-
280
-
281
-
282
-
283
-
284
 |
 |

Bank of America 2012 199
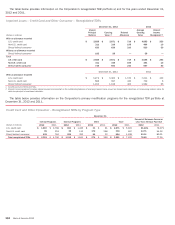
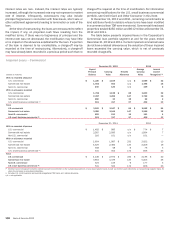
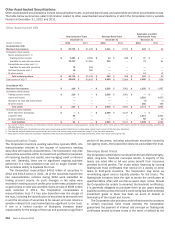
The table below presents the allowance and the carrying value of outstanding loans and leases by portfolio segment at December
31, 2012 and 2011.
Allowance and Carrying Value by Portfolio Segment
December 31, 2012
(Dollars in millions)
Home
Loans
Credit Card
and Other
Consumer Commercial Total
Impaired loans and troubled debt restructurings (1)
Allowance for loan and lease losses (2) $ 1,700 $ 1,127 $ 330 $ 3,157
Carrying value (3) 30,250 3,881 4,881 39,012
Allowance as a percentage of carrying value 5.62% 29.04% 6.76% 8.09%
Loans collectively evaluated for impairment
Allowance for loan and lease losses $ 7,697 $ 5,013 $ 2,776 $ 15,486
Carrying value (3, 4) 304,701 187,484 341,502 833,687
Allowance as a percentage of carrying value (4) 2.53%2.67%0.81% 1.86%
Purchased credit-impaired loans
Valuation allowance $ 5,536 n/a n/a $ 5,536
Carrying value gross of valuation allowance 26,118 n/a n/a 26,118
Valuation allowance as a percentage of carrying value 21.20% n/a n/a 21.20%
Total
Allowance for loan and lease losses $ 14,933 $ 6,140 $ 3,106 $ 24,179
Carrying value (3, 4) 361,069 191,365 346,383 898,817
Allowance as a percentage of carrying value (4) 4.14%3.21%0.90% 2.69%
December 31, 2011
Impaired loans and troubled debt restructurings (1)
Allowance for loan and lease losses (2) $ 1,946 $ 2,410 $ 545 $ 4,901
Carrying value (3) 21,462 7,100 8,113 36,675
Allowance as a percentage of carrying value 9.07% 33.94% 6.71% 13.36%
Loans collectively evaluated for impairment
Allowance for loan and lease losses $ 10,674 $ 6,159 $ 3,590 $ 20,423
Carrying value (3, 4) 344,821 202,010 302,089 848,920
Allowance as a percentage of carrying value (4) 3.10% 3.05% 1.19% 2.41%
Purchased credit-impaired loans
Valuation allowance $ 8,459 n/a n/a $ 8,459
Carrying value gross of valuation allowance 31,801 n/a n/a 31,801
Valuation allowance as a percentage of carrying value 26.60% n/a n/a 26.60%
Total
Allowance for loan and lease losses $ 21,079 $ 8,569 $ 4,135 $ 33,783
Carrying value (3, 4) 398,084 209,110 310,202 917,396
Allowance as a percentage of carrying value (4) 5.30% 4.10% 1.33% 3.68%
(1) Impaired loans include nonperforming commercial loans and all TDRs, including both commercial and consumer TDRs. Impaired loans exclude nonperforming consumer loans unless they are TDRs,
and all consumer and commercial loans accounted for under the fair value option.
(2) Commercial impaired allowance for loan and lease losses includes $97 million and $172 million of renegotiated TDR loans related to U.S. small business commercial at December 31, 2012 and
2011.
(3) Amounts are presented gross of the allowance for loan and lease losses.
(4) Outstanding loan and lease balances and ratios do not include loans accounted for under the fair value option of $9.0 billion and $8.8 billion at December 31, 2012 and 2011.
n/a = not applicable