Bank of America 2012 Annual Report Download - page 241
Download and view the complete annual report
Please find page 241 of the 2012 Bank of America annual report below. You can navigate through the pages in the report by either clicking on the pages listed below, or by using the keyword search tool below to find specific information within the annual report.-
 1
1 -
2
-
3
-
4
-
5
-
6
-
7
-
8
-
9
-
10
-
11
-
12
-
13
-
14
-
15
-
16
-
17
-
18
-
19
-
20
-
21
-
22
-
23
-
24
-
25
-
26
-
27
-
28
-
29
-
30
-
31
-
32
-
33
-
34
-
35
-
36
-
37
-
38
-
39
-
40
-
41
-
42
-
43
-
44
-
45
-
46
-
47
-
48
-
49
-
50
-
51
-
52
-
53
-
54
-
55
-
56
-
57
-
58
-
59
-
60
-
61
-
62
-
63
-
64
-
65
-
66
-
67
-
68
-
69
-
70
-
71
-
72
-
73
-
74
-
75
-
76
-
77
-
78
-
79
-
80
-
81
-
82
-
83
-
84
-
85
-
86
-
87
-
88
-
89
-
90
-
91
-
92
-
93
-
94
-
95
-
96
-
97
-
98
-
99
-
100
-
101
-
102
-
103
-
104
-
105
-
106
-
107
-
108
-
109
-
110
-
111
-
112
-
113
-
114
-
115
-
116
-
117
-
118
-
119
-
120
-
121
-
122
-
123
-
124
-
125
-
126
-
127
-
128
-
129
-
130
-
131
-
132
-
133
-
134
-
135
-
136
-
137
-
138
-
139
-
140
-
141
-
142
-
143
-
144
-
145
-
146
-
147
-
148
-
149
-
150
-
151
-
152
-
153
-
154
-
155
-
156
-
157
-
158
-
159
-
160
-
161
-
162
-
163
-
164
-
165
-
166
-
167
-
168
-
169
-
170
-
171
-
172
-
173
-
174
-
175
-
176
-
177
-
178
-
179
-
180
-
181
-
182
-
183
-
184
-
185
-
186
-
187
-
188
-
189
-
190
-
191
-
192
-
193
-
194
-
195
-
196
-
197
-
198
-
199
-
200
-
201
-
202
-
203
-
204
-
205
-
206
-
207
-
208
-
209
-
210
-
211
-
212
-
213
-
214
-
215
-
216
-
217
-
218
-
219
-
220
-
221
-
222
-
223
-
224
-
225
-
226
-
227
-
228
-
229
-
230
-
 231
231 -
 232
232 -
 233
233 -
 234
234 -
 235
235 -
 236
236 -
 237
237 -
 238
238 -
 239
239 -
 240
240 -
 241
241 -
 242
242 -
 243
243 -
 244
244 -
 245
245 -
 246
246 -
 247
247 -
 248
248 -
 249
249 -
 250
250 -
 251
251 -
252
-
253
-
254
-
255
-
256
-
257
-
258
-
259
-
260
-
261
-
262
-
263
-
264
-
265
-
266
-
267
-
268
-
269
-
270
-
271
-
272
-
273
-
274
-
275
-
276
-
277
-
278
-
279
-
280
-
281
-
282
-
283
-
284
 |
 |

Bank of America 2012 239
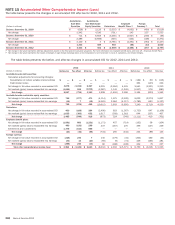
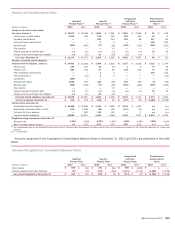
NOTE 16 Earnings Per Common Share
The calculation of EPS and diluted EPS for 2012, 2011 and 2010 is presented below. See Note 1 – Summary of Significant Accounting
Principles for additional information on the calculation of EPS.
(Dollars in millions, except per share information; shares in thousands) 2012 2011 2010
Earnings (loss) per common share
Net income (loss) $ 4,188 $ 1,446 $ (2,238)
Preferred stock dividends (1,428)(1,361) (1,357)
Net income (loss) applicable to common shareholders 2,760 85 (3,595)
Dividends and undistributed earnings allocated to participating securities (2) (1) (4)
Net income (loss) allocated to common shareholders $ 2,758 $ 84 $ (3,599)
Average common shares issued and outstanding 10,746,028 10,142,625 9,790,472
Earnings (loss) per common share $ 0.26 $ 0.01 $ (0.37)
Diluted earnings (loss) per common share
Net income (loss) applicable to common shareholders $ 2,760 $ 85 $ (3,595)
Dividends and undistributed earnings allocated to participating securities (2) (1) (4)
Net income (loss) allocated to common shareholders $ 2,758 $ 84 $ (3,599)
Average common shares issued and outstanding 10,746,028 10,142,625 9,790,472
Dilutive potential common shares (1) 94,826 112,199 —
Total diluted average common shares issued and outstanding 10,840,854 10,254,824 9,790,472
Diluted earnings (loss) per common share $ 0.25 $ 0.01 $ (0.37)
(1) Includes incremental shares from RSUs, restricted stock, stock options and warrants.
For 2012 and 2011, 62 million and 66 million average dilutive
potential common shares associated with the Series L Preferred
Stock were not included in the diluted share count because the
result would have been antidilutive under the “if-converted”
method. For 2010, 107 million average dilutive potential common
shares associated with the Series L Preferred Stock, and the
mandatory convertible Preferred Stock Series 2 and Series 3 of
Merrill Lynch were not included in the diluted share count because
the result would have been antidilutive under the “if-converted”
method. For 2012 and 2011, 700 million and 234 million average
dilutive potential common shares associated with the Series T
Preferred Stock were not included in the diluted share count
because the result would have been antidilutive under the “if-
converted” method. For 2012, 2011 and 2010, average options
to purchase 163 million, 217 million and 271 million shares,
respectively, of common stock were outstanding but not included
in the computation of EPS because the result would have been
antidilutive under the treasury stock method. For 2012, 2011 and
2010, average warrants to purchase 272 million shares of
common stock were outstanding but not included in the
computation of EPS because the result would have been
antidilutive under the treasury stock method.
Due to the net loss applicable to common shareholders for
2010, no dilutive potential common shares were included in the
calculation of diluted EPS because they would have been
antidilutive.
In 2012 and 2011, in connection with the exchanges described
in Note 14 – Shareholders’ Equity, the Corporation recorded a $44
million reduction to preferred stock dividends and a net $36 million
non-cash preferred stock dividend which are included in the
calculation of net income allocated to common shareholders.
NOTE 17 Regulatory Requirements and
Restrictions
The Corporation manages regulatory capital to adhere to internal
capital guidelines and regulatory standards of capital adequacy
based on its current understanding of the rules and the application
of such rules to its business as currently conducted.
The Federal Reserve, OCC (Office of the Comptroller of the
Currency) and FDIC (collectively, joint agencies) have in place
regulatory capital guidelines for U.S. banking organizations. The
regulatory capital guidelines measure capital in relation to the
credit and market risks of both on- and off-balance sheet items
using various risk weights. Under the regulatory capital guidelines,
Total capital consists of three tiers of capital. Tier 1 capital includes
the sum of “core capital elements,” the principal components of
which are qualifying common shareholders’ equity and qualifying
non-cumulative perpetual preferred stock. Also included in Tier 1
capital are qualifying trust preferred securities (Trust Securities),
hybrid securities and qualifying noncontrolling interests in
subsidiaries which are subject to the rules governing “restricted
core capital elements.” Goodwill, other disallowed intangible
assets, disallowed deferred tax assets and the cumulative
changes in fair value of all financial liabilities accounted for under
the fair value option that are included in retained earnings and are
attributable to changes in the company’s own creditworthiness are
deducted from the sum of core capital elements. Tier 2 capital
consists of qualifying subordinated debt, a limited portion of the
allowance for loan and lease losses, a portion of net unrealized
gains on AFS marketable equity securities and other adjustments.
Tier 3 capital includes subordinated debt that is unsecured, fully
paid, has an original maturity of at least two years, is not
redeemable before maturity without prior approval by the Federal
Reserve and includes a lock-in clause precluding payment of either
interest or principal if the payment would cause the issuing bank’s
risk-based capital ratio to fall or remain below the required
minimum. Tier 3 capital can only be used to satisfy the
Corporation’s market risk capital requirement and may not be used
to support its credit risk requirement. At December 31, 2012 and
2011, the Corporation had no subordinated debt that qualified as