Bank of America 2012 Annual Report Download - page 249
Download and view the complete annual report
Please find page 249 of the 2012 Bank of America annual report below. You can navigate through the pages in the report by either clicking on the pages listed below, or by using the keyword search tool below to find specific information within the annual report.-
 1
1 -
2
-
3
-
4
-
5
-
6
-
7
-
8
-
9
-
10
-
11
-
12
-
13
-
14
-
15
-
16
-
17
-
18
-
19
-
20
-
21
-
22
-
23
-
24
-
25
-
26
-
27
-
28
-
29
-
30
-
31
-
32
-
33
-
34
-
35
-
36
-
37
-
38
-
39
-
40
-
41
-
42
-
43
-
44
-
45
-
46
-
47
-
48
-
49
-
50
-
51
-
52
-
53
-
54
-
55
-
56
-
57
-
58
-
59
-
60
-
61
-
62
-
63
-
64
-
65
-
66
-
67
-
68
-
69
-
70
-
71
-
72
-
73
-
74
-
75
-
76
-
77
-
78
-
79
-
80
-
81
-
82
-
83
-
84
-
85
-
86
-
87
-
88
-
89
-
90
-
91
-
92
-
93
-
94
-
95
-
96
-
97
-
98
-
99
-
100
-
101
-
102
-
103
-
104
-
105
-
106
-
107
-
108
-
109
-
110
-
111
-
112
-
113
-
114
-
115
-
116
-
117
-
118
-
119
-
120
-
121
-
122
-
123
-
124
-
125
-
126
-
127
-
128
-
129
-
130
-
131
-
132
-
133
-
134
-
135
-
136
-
137
-
138
-
139
-
140
-
141
-
142
-
143
-
144
-
145
-
146
-
147
-
148
-
149
-
150
-
151
-
152
-
153
-
154
-
155
-
156
-
157
-
158
-
159
-
160
-
161
-
162
-
163
-
164
-
165
-
166
-
167
-
168
-
169
-
170
-
171
-
172
-
173
-
174
-
175
-
176
-
177
-
178
-
179
-
180
-
181
-
182
-
183
-
184
-
185
-
186
-
187
-
188
-
189
-
190
-
191
-
192
-
193
-
194
-
195
-
196
-
197
-
198
-
199
-
200
-
201
-
202
-
203
-
204
-
205
-
206
-
207
-
208
-
209
-
210
-
211
-
212
-
213
-
214
-
215
-
216
-
217
-
218
-
219
-
220
-
221
-
222
-
223
-
224
-
225
-
226
-
227
-
228
-
229
-
230
-
231
-
232
-
233
-
234
-
235
-
236
-
237
-
238
-
 239
239 -
 240
240 -
 241
241 -
 242
242 -
 243
243 -
 244
244 -
 245
245 -
 246
246 -
 247
247 -
 248
248 -
 249
249 -
 250
250 -
 251
251 -
 252
252 -
 253
253 -
 254
254 -
 255
255 -
 256
256 -
 257
257 -
 258
258 -
 259
259 -
260
-
261
-
262
-
263
-
264
-
265
-
266
-
267
-
268
-
269
-
270
-
271
-
272
-
273
-
274
-
275
-
276
-
277
-
278
-
279
-
280
-
281
-
282
-
283
-
284
 |
 |

Bank of America 2012 247
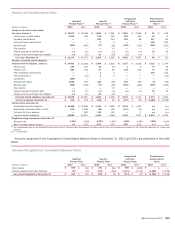
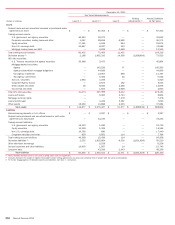
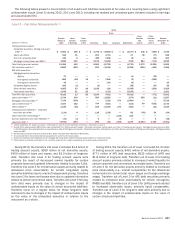
Plan investment assets measured at fair value by level and in total at December 31, 2012 and 2011 are summarized in the Fair
Value Measurements table.
Fair Value Measurements
December 31, 2012
(Dollars in millions) Level 1 Level 2 Level 3 Total
Cash and short-term investments
Money market and interest-bearing cash $ 1,404 $ —$ —$ 1,404
Cash and cash equivalent commingled/mutual funds —96—96
Fixed income
U.S. government and government agency securities 1,317 2,829 13 4,159
Corporate debt securities — 1,062 —1,062
Asset-backed securities — 1,109 —1,109
Non-U.S. debt securities 70 535 10 615
Fixed income commingled/mutual funds 99 1,432 —1,531
Equity
Common and preferred equity securities 7,432 — —7,432
Equity commingled/mutual funds 290 2,316 —2,606
Public real estate investment trusts 236 ——236
Real estate
Private real estate ——
110 110
Real estate commingled/mutual funds —10324 334
Limited partnerships — 110 231 341
Other investments (1) 22 543 129 694
Total plan investment assets, at fair value $ 10,870 $ 10,042 $ 817 $ 21,729
December 31, 2011
Cash and short-term investments
Money market and interest-bearing cash $ 1,065 $ —$ — $ 1,065
Cash and cash equivalent commingled/mutual funds — 30 — 30
Fixed income
U.S. government and government agency securities 1,197 2,899 13 4,109
Corporate debt securities — 1,058 — 1,058
Asset-backed securities — 907 — 907
Non-U.S. debt securities 53 479 10 542
Fixed income commingled/mutual funds 82 1,487 — 1,569
Equity
Common and preferred equity securities 6,862 — — 6,862
Equity commingled/mutual funds 390 2,094 — 2,484
Public real estate investment trusts 200 — — 200
Real estate
Private real estate — — 113 113
Real estate commingled/mutual funds — 11 249 260
Limited partnerships — 105 232 337
Other investments (1) 14 572 122 708
Total plan investment assets, at fair value $ 9,863 $ 9,642 $ 739 $ 20,244
(1) Other investments include interest rate swaps of $311 million and $467 million, participant loans of $76 million and $75 million, commodity and balanced funds of $239 million and $116 million
and other various investments of $68 million and $50 million at December 31, 2012 and 2011.