Bank of America 2012 Annual Report Download - page 277
Download and view the complete annual report
Please find page 277 of the 2012 Bank of America annual report below. You can navigate through the pages in the report by either clicking on the pages listed below, or by using the keyword search tool below to find specific information within the annual report.-
 1
1 -
2
-
3
-
4
-
5
-
6
-
7
-
8
-
9
-
10
-
11
-
12
-
13
-
14
-
15
-
16
-
17
-
18
-
19
-
20
-
21
-
22
-
23
-
24
-
25
-
26
-
27
-
28
-
29
-
30
-
31
-
32
-
33
-
34
-
35
-
36
-
37
-
38
-
39
-
40
-
41
-
42
-
43
-
44
-
45
-
46
-
47
-
48
-
49
-
50
-
51
-
52
-
53
-
54
-
55
-
56
-
57
-
58
-
59
-
60
-
61
-
62
-
63
-
64
-
65
-
66
-
67
-
68
-
69
-
70
-
71
-
72
-
73
-
74
-
75
-
76
-
77
-
78
-
79
-
80
-
81
-
82
-
83
-
84
-
85
-
86
-
87
-
88
-
89
-
90
-
91
-
92
-
93
-
94
-
95
-
96
-
97
-
98
-
99
-
100
-
101
-
102
-
103
-
104
-
105
-
106
-
107
-
108
-
109
-
110
-
111
-
112
-
113
-
114
-
115
-
116
-
117
-
118
-
119
-
120
-
121
-
122
-
123
-
124
-
125
-
126
-
127
-
128
-
129
-
130
-
131
-
132
-
133
-
134
-
135
-
136
-
137
-
138
-
139
-
140
-
141
-
142
-
143
-
144
-
145
-
146
-
147
-
148
-
149
-
150
-
151
-
152
-
153
-
154
-
155
-
156
-
157
-
158
-
159
-
160
-
161
-
162
-
163
-
164
-
165
-
166
-
167
-
168
-
169
-
170
-
171
-
172
-
173
-
174
-
175
-
176
-
177
-
178
-
179
-
180
-
181
-
182
-
183
-
184
-
185
-
186
-
187
-
188
-
189
-
190
-
191
-
192
-
193
-
194
-
195
-
196
-
197
-
198
-
199
-
200
-
201
-
202
-
203
-
204
-
205
-
206
-
207
-
208
-
209
-
210
-
211
-
212
-
213
-
214
-
215
-
216
-
217
-
218
-
219
-
220
-
221
-
222
-
223
-
224
-
225
-
226
-
227
-
228
-
229
-
230
-
231
-
232
-
233
-
234
-
235
-
236
-
237
-
238
-
239
-
240
-
241
-
242
-
243
-
244
-
245
-
246
-
247
-
248
-
249
-
250
-
251
-
252
-
253
-
254
-
255
-
256
-
257
-
258
-
259
-
260
-
261
-
262
-
263
-
264
-
265
-
266
-
 267
267 -
 268
268 -
 269
269 -
 270
270 -
 271
271 -
 272
272 -
 273
273 -
 274
274 -
 275
275 -
 276
276 -
 277
277 -
 278
278 -
 279
279 -
 280
280 -
 281
281 -
 282
282 -
 283
283 -
 284
284
 |
 |

Bank of America 2012 275
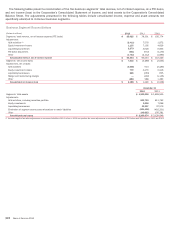
NOTE 27 Parent Company Information
The following tables present the Parent Company-only financial information.
Condensed Statement of Income
(Dollars in millions) 2012 2011 2010
Income
Dividends from subsidiaries:
Bank holding companies and related subsidiaries $ 16,213 $ 10,277 $ 7,263
Nonbank companies and related subsidiaries 542 553 226
Interest from subsidiaries 627 869 999
Other income (loss) (1) (304)10,603 2,781
Total income 17,078 22,302 11,269
Expense
Interest on borrowed funds 5,376 6,234 4,484
Noninterest expense (2) 11,643 11,861 8,030
Total expense 17,019 18,095 12,514
Income (loss) before income taxes and equity in undistributed earnings of subsidiaries 59 4,207 (1,245)
Income tax benefit (5,883)(2,783) (3,709)
Income before equity in undistributed earnings of subsidiaries 5,942 6,990 2,464
Equity in undistributed earnings (losses) of subsidiaries:
Bank holding companies and related subsidiaries 1,072 6,650 7,647
Nonbank companies and related subsidiaries (2,826)(12,194) (12,349)
Total equity in undistributed losses of subsidiaries (1,754)(5,544) (4,702)
Net income (loss) $ 4,188 $ 1,446 $ (2,238)
Net income (loss) applicable to common shareholders $ 2,760 $ 85 $ (3,595)
(1) Includes $6.5 billion of gains related to the sale of the Corporation’s investment in CCB in 2011.
(2) Includes, in aggregate, $4.1 billion, $6.9 billion and $3.5 billion in 2012, 2011 and 2010 of representations and warranties provision, which is presented as a component of mortgage banking
income on the Corporation’s Consolidated Statement of Income, litigation expense and in 2012 an expense related to an agreement with the Federal Reserve and the OCC to cease the Independent
Foreclosure Review and replace it with an accelerated remediation process. The Parent Company-only financial information is presented in accordance with bank regulatory reporting requirements.
Condensed Balance Sheet
December 31
(Dollars in millions) 2012 2011
Assets
Cash held at bank subsidiaries $ 101,831 $ 124,991
Securities 1,959 515
Receivables from subsidiaries:
Bank holding companies and related subsidiaries 33,481 48,679
Nonbank companies and related subsidiaries 3,861 7,385
Investments in subsidiaries:
Bank holding companies and related subsidiaries 185,803 191,278
Nonbank companies and related subsidiaries 65,300 53,213
Other assets 15,208 11,720
Total assets $ 407,443 $ 437,781
Liabilities and shareholders’ equity
Commercial paper and other short-term borrowings $100 $ 401
Accrued expenses and other liabilities 34,364 22,419
Payables to subsidiaries:
Bank holding companies and related subsidiaries 1,396 2,925
Nonbank companies and related subsidiaries 688 515
Long-term debt 133,939 181,420
Shareholders’ equity 236,956 230,101
Total liabilities and shareholders’ equity $ 407,443 $ 437,781