Bank of America 2012 Annual Report Download - page 178
Download and view the complete annual report
Please find page 178 of the 2012 Bank of America annual report below. You can navigate through the pages in the report by either clicking on the pages listed below, or by using the keyword search tool below to find specific information within the annual report.-
 1
1 -
2
-
3
-
4
-
5
-
6
-
7
-
8
-
9
-
10
-
11
-
12
-
13
-
14
-
15
-
16
-
17
-
18
-
19
-
20
-
21
-
22
-
23
-
24
-
25
-
26
-
27
-
28
-
29
-
30
-
31
-
32
-
33
-
34
-
35
-
36
-
37
-
38
-
39
-
40
-
41
-
42
-
43
-
44
-
45
-
46
-
47
-
48
-
49
-
50
-
51
-
52
-
53
-
54
-
55
-
56
-
57
-
58
-
59
-
60
-
61
-
62
-
63
-
64
-
65
-
66
-
67
-
68
-
69
-
70
-
71
-
72
-
73
-
74
-
75
-
76
-
77
-
78
-
79
-
80
-
81
-
82
-
83
-
84
-
85
-
86
-
87
-
88
-
89
-
90
-
91
-
92
-
93
-
94
-
95
-
96
-
97
-
98
-
99
-
100
-
101
-
102
-
103
-
104
-
105
-
106
-
107
-
108
-
109
-
110
-
111
-
112
-
113
-
114
-
115
-
116
-
117
-
118
-
119
-
120
-
121
-
122
-
123
-
124
-
125
-
126
-
127
-
128
-
129
-
130
-
131
-
132
-
133
-
134
-
135
-
136
-
137
-
138
-
139
-
140
-
141
-
142
-
143
-
144
-
145
-
146
-
147
-
148
-
149
-
150
-
151
-
152
-
153
-
154
-
155
-
156
-
157
-
158
-
159
-
160
-
161
-
162
-
163
-
164
-
165
-
166
-
167
-
 168
168 -
 169
169 -
 170
170 -
 171
171 -
 172
172 -
 173
173 -
 174
174 -
 175
175 -
 176
176 -
 177
177 -
 178
178 -
 179
179 -
 180
180 -
 181
181 -
 182
182 -
 183
183 -
 184
184 -
 185
185 -
 186
186 -
 187
187 -
 188
188 -
189
-
190
-
191
-
192
-
193
-
194
-
195
-
196
-
197
-
198
-
199
-
200
-
201
-
202
-
203
-
204
-
205
-
206
-
207
-
208
-
209
-
210
-
211
-
212
-
213
-
214
-
215
-
216
-
217
-
218
-
219
-
220
-
221
-
222
-
223
-
224
-
225
-
226
-
227
-
228
-
229
-
230
-
231
-
232
-
233
-
234
-
235
-
236
-
237
-
238
-
239
-
240
-
241
-
242
-
243
-
244
-
245
-
246
-
247
-
248
-
249
-
250
-
251
-
252
-
253
-
254
-
255
-
256
-
257
-
258
-
259
-
260
-
261
-
262
-
263
-
264
-
265
-
266
-
267
-
268
-
269
-
270
-
271
-
272
-
273
-
274
-
275
-
276
-
277
-
278
-
279
-
280
-
281
-
282
-
283
-
284
 |
 |

176 Bank of America 2012
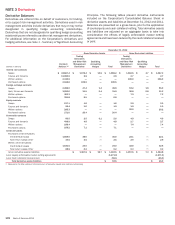
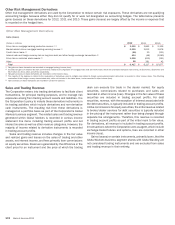
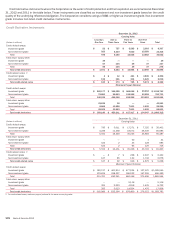
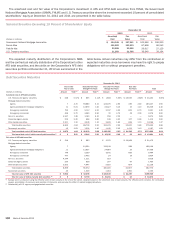
Credit derivative instruments where the Corporation is the seller of credit protection and their expiration are summarized at December
31, 2012 and 2011 in the table below. These instruments are classified as investment and non-investment grade based on the credit
quality of the underlying referenced obligation. The Corporation considers ratings of BBB- or higher as investment grade. Non-investment
grade includes non-rated credit derivative instruments.
Credit Derivative Instruments
December 31, 2012
Carrying Value
(Dollars in millions)
Less than
One Year
One to
Three Years
Three to
Five Years
Over Five
Years Total
Credit default swaps:
Investment grade $ 52 $ 757 $ 5,595 $ 2,903 $ 9,307
Non-investment grade 923 4,403 7,030 10,959 23,315
Total 975 5,160 12,625 13,862 32,622
Total return swaps/other:
Investment grade 39 — ——
39
Non-investment grade 57 104 39 37 237
Total 96 104 39 37 276
Total credit derivatives $ 1,071 $ 5,264 $ 12,664 $ 13,899 $ 32,898
Credit-related notes: (1)
Investment grade $ 4 $ 12 $ 441 $ 3,849 $ 4,306
Non-investment grade 116 161 314 1,425 2,016
Total credit-related notes $ 120 $173 $755 $ 5,274 $ 6,322
Maximum Payout/Notional
Credit default swaps:
Investment grade $ 260,177 $ 349,125 $ 500,038 $ 90,453 $ 1,199,793
Non-investment grade 79,861 99,043 110,248 42,559 331,711
Total 340,038 448,168 610,286 133,012 1,531,504
Total return swaps/other:
Investment grade 43,536 15 ——
43,551
Non-investment grade 5,566 11,028 7,631 1,035 25,260
Total 49,102 11,043 7,631 1,035 68,811
Total credit derivatives $ 389,140 $ 459,211 $ 617,917 $ 134,047 $ 1,600,315
December 31, 2011
(Dollars in millions) Carrying Value
Credit default swaps:
Investment grade $ 795 $ 5,011 $ 17,271 $ 7,325 $ 30,402
Non-investment grade 4,236 11,438 18,072 26,339 60,085
Total 5,031 16,449 35,343 33,664 90,487
Total return swaps/other:
Investment grade — — 30 1 31
Non-investment grade 522 2 33 128 685
Total 522 2 63 129 716
Total credit derivatives $ 5,553 $ 16,451 $ 35,406 $ 33,793 $ 91,203
Credit-related notes: (1)
Investment grade $ — $ 7 $ 208 $ 2,947 $ 3,162
Non-investment grade 127 85 132 1,732 2,076
Total credit-related notes $ 127 $ 92 $ 340 $ 4,679 $ 5,238
Maximum Payout/Notional
Credit default swaps:
Investment grade $ 182,137 $401,914 $477,924 $127,570 $ 1,189,545
Non-investment grade 133,624 228,327 186,522 147,926 696,399
Total 315,761 630,241 664,446 275,496 1,885,944
Total return swaps/other:
Investment grade — — 9,116 — 9,116
Non-investment grade 305 2,023 4,918 1,476 8,722
Total 305 2,023 14,034 1,476 17,838
Total credit derivatives $316,066 $632,264 $678,480 $276,972 $ 1,903,782
(1) For credit-related notes, maximum payout/notional is the same as carrying value.