Bank of America 2012 Annual Report Download - page 133
Download and view the complete annual report
Please find page 133 of the 2012 Bank of America annual report below. You can navigate through the pages in the report by either clicking on the pages listed below, or by using the keyword search tool below to find specific information within the annual report.-
 1
1 -
2
-
3
-
4
-
5
-
6
-
7
-
8
-
9
-
10
-
11
-
12
-
13
-
14
-
15
-
16
-
17
-
18
-
19
-
20
-
21
-
22
-
23
-
24
-
25
-
26
-
27
-
28
-
29
-
30
-
31
-
32
-
33
-
34
-
35
-
36
-
37
-
38
-
39
-
40
-
41
-
42
-
43
-
44
-
45
-
46
-
47
-
48
-
49
-
50
-
51
-
52
-
53
-
54
-
55
-
56
-
57
-
58
-
59
-
60
-
61
-
62
-
63
-
64
-
65
-
66
-
67
-
68
-
69
-
70
-
71
-
72
-
73
-
74
-
75
-
76
-
77
-
78
-
79
-
80
-
81
-
82
-
83
-
84
-
85
-
86
-
87
-
88
-
89
-
90
-
91
-
92
-
93
-
94
-
95
-
96
-
97
-
98
-
99
-
100
-
101
-
102
-
103
-
104
-
105
-
106
-
107
-
108
-
109
-
110
-
111
-
112
-
113
-
114
-
115
-
116
-
117
-
118
-
119
-
120
-
121
-
122
-
 123
123 -
 124
124 -
 125
125 -
 126
126 -
 127
127 -
 128
128 -
 129
129 -
 130
130 -
 131
131 -
 132
132 -
 133
133 -
 134
134 -
 135
135 -
 136
136 -
 137
137 -
 138
138 -
 139
139 -
 140
140 -
 141
141 -
 142
142 -
 143
143 -
144
-
145
-
146
-
147
-
148
-
149
-
150
-
151
-
152
-
153
-
154
-
155
-
156
-
157
-
158
-
159
-
160
-
161
-
162
-
163
-
164
-
165
-
166
-
167
-
168
-
169
-
170
-
171
-
172
-
173
-
174
-
175
-
176
-
177
-
178
-
179
-
180
-
181
-
182
-
183
-
184
-
185
-
186
-
187
-
188
-
189
-
190
-
191
-
192
-
193
-
194
-
195
-
196
-
197
-
198
-
199
-
200
-
201
-
202
-
203
-
204
-
205
-
206
-
207
-
208
-
209
-
210
-
211
-
212
-
213
-
214
-
215
-
216
-
217
-
218
-
219
-
220
-
221
-
222
-
223
-
224
-
225
-
226
-
227
-
228
-
229
-
230
-
231
-
232
-
233
-
234
-
235
-
236
-
237
-
238
-
239
-
240
-
241
-
242
-
243
-
244
-
245
-
246
-
247
-
248
-
249
-
250
-
251
-
252
-
253
-
254
-
255
-
256
-
257
-
258
-
259
-
260
-
261
-
262
-
263
-
264
-
265
-
266
-
267
-
268
-
269
-
270
-
271
-
272
-
273
-
274
-
275
-
276
-
277
-
278
-
279
-
280
-
281
-
282
-
283
-
284
 |
 |

Bank of America 2012 131
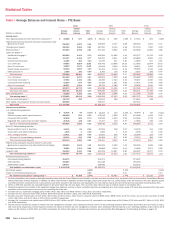
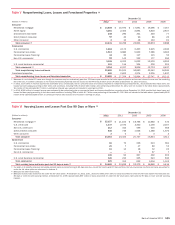
Table V Nonperforming Loans, Leases and Foreclosed Properties (1)
December 31
(Dollars in millions) 2012 2011 2010 2009 2008
Consumer
Residential mortgage $ 14,808 $ 15,970 $ 17,691 $ 16,596 $ 7,057
Home equity 4,281 2,453 2,694 3,804 2,637
Discontinued real estate 248 290 331 249 77
Direct/Indirect consumer 92 40 90 86 26
Other consumer 215 48 104 91
Total consumer (2) 19,431 18,768 20,854 20,839 9,888
Commercial
U.S. commercial 1,484 2,174 3,453 4,925 2,040
Commercial real estate 1,513 3,880 5,829 7,286 3,906
Commercial lease financing 44 26 117 115 56
Non-U.S. commercial 68 143 233 177 290
3,109 6,223 9,632 12,503 6,292
U.S. small business commercial 115 114 204 200 205
Total commercial (3) 3,224 6,337 9,836 12,703 6,497
Total nonperforming loans and leases 22,655 25,105 30,690 33,542 16,385
Foreclosed properties 900 2,603 1,974 2,205 1,827
Total nonperforming loans, leases and foreclosed properties $ 23,555 $ 27,708 $ 32,664 $ 35,747 $ 18,212
(1) Balances do not include PCI loans even though the customer may be contractually past due. PCI loans were recorded at fair value upon acquisition and accrete interest income over the remaining
life of the loan. In addition, balances do not include foreclosed properties that are insured by the FHA of $2.5 billion and $1.4 billion at December 31, 2012 and 2011.
(2) In 2012, $2.7 billion in interest income was estimated to be contractually due on consumer loans and leases classified as nonperforming at December 31, 2012 provided that these loans and
leases had been paying according to their terms and conditions, including TDRs of which $20.0 billion were performing at December 31, 2012 and not included in the table above. Approximately
$1.2 billion of the estimated $2.7 billion in contractual interest was received and included in earnings for 2012.
(3) In 2012, $266 million in interest income was estimated to be contractually due on commercial loans and leases classified as nonperforming at December 31, 2012 provided that these loans and
leases had been paying according to their terms and conditions, including TDRs of which $1.7 billion were performing at December 31, 2012 and not included in the table above. Approximately $106
million of the estimated $266 million in contractual interest was received and included in earnings for 2012.
Table VI Accruing Loans and Leases Past Due 90 Days or More (1)
December 31
(Dollars in millions) 2012 2011 2010 2009 2008
Consumer
Residential mortgage (2) $ 22,157 $ 21,164 $ 16,768 $ 11,680 $ 372
U.S. credit card 1,437 2,070 3,320 2,158 2,197
Non-U.S. credit card 212 342 599 515 368
Direct/Indirect consumer 545 746 1,058 1,488 1,370
Other consumer 22234
Total consumer 24,353 24,324 21,747 15,844 4,311
Commercial
U.S. commercial 65 75 236 213 381
Commercial real estate 29 7 47 80 52
Commercial lease financing 15 14 18 32 23
Non-U.S. commercial —— 6 67 7
109 96 307 392 463
U.S. small business commercial 120 216 325 624 640
Total commercial 229 312 632 1,016 1,103
Total accruing loans and leases past due 90 days or more (3) $ 24,582 $ 24,636 $ 22,379 $ 16,860 $ 5,414
(1) Our policy is to classify consumer real estate-secured loans as nonperforming at 90 days past due, except the Countrywide PCI loan portfolio, the fully-insured loan portfolio and loans accounted for
under the fair value option as referenced in footnote 3.
(2) Balances are fully-insured loans.
(3) Balances exclude loans accounted for under the fair value option. At December 31, 2012, 2011, 2010 and 2008, there were no loans accounted for under the fair value option that were past due
90 days or more and still accruing interest. At December 31, 2009, approximately $87 million of loans accounted for under the fair value option were past due 90 days or more and still accruing
interest.