Bank of America 2012 Annual Report Download - page 44
Download and view the complete annual report
Please find page 44 of the 2012 Bank of America annual report below. You can navigate through the pages in the report by either clicking on the pages listed below, or by using the keyword search tool below to find specific information within the annual report.-
 1
1 -
2
-
3
-
4
-
5
-
6
-
7
-
8
-
9
-
10
-
11
-
12
-
13
-
14
-
15
-
16
-
17
-
18
-
19
-
20
-
21
-
22
-
23
-
24
-
25
-
26
-
27
-
28
-
29
-
30
-
31
-
32
-
33
-
 34
34 -
 35
35 -
 36
36 -
 37
37 -
 38
38 -
 39
39 -
 40
40 -
 41
41 -
 42
42 -
 43
43 -
 44
44 -
 45
45 -
 46
46 -
 47
47 -
 48
48 -
 49
49 -
 50
50 -
 51
51 -
 52
52 -
 53
53 -
 54
54 -
55
-
56
-
57
-
58
-
59
-
60
-
61
-
62
-
63
-
64
-
65
-
66
-
67
-
68
-
69
-
70
-
71
-
72
-
73
-
74
-
75
-
76
-
77
-
78
-
79
-
80
-
81
-
82
-
83
-
84
-
85
-
86
-
87
-
88
-
89
-
90
-
91
-
92
-
93
-
94
-
95
-
96
-
97
-
98
-
99
-
100
-
101
-
102
-
103
-
104
-
105
-
106
-
107
-
108
-
109
-
110
-
111
-
112
-
113
-
114
-
115
-
116
-
117
-
118
-
119
-
120
-
121
-
122
-
123
-
124
-
125
-
126
-
127
-
128
-
129
-
130
-
131
-
132
-
133
-
134
-
135
-
136
-
137
-
138
-
139
-
140
-
141
-
142
-
143
-
144
-
145
-
146
-
147
-
148
-
149
-
150
-
151
-
152
-
153
-
154
-
155
-
156
-
157
-
158
-
159
-
160
-
161
-
162
-
163
-
164
-
165
-
166
-
167
-
168
-
169
-
170
-
171
-
172
-
173
-
174
-
175
-
176
-
177
-
178
-
179
-
180
-
181
-
182
-
183
-
184
-
185
-
186
-
187
-
188
-
189
-
190
-
191
-
192
-
193
-
194
-
195
-
196
-
197
-
198
-
199
-
200
-
201
-
202
-
203
-
204
-
205
-
206
-
207
-
208
-
209
-
210
-
211
-
212
-
213
-
214
-
215
-
216
-
217
-
218
-
219
-
220
-
221
-
222
-
223
-
224
-
225
-
226
-
227
-
228
-
229
-
230
-
231
-
232
-
233
-
234
-
235
-
236
-
237
-
238
-
239
-
240
-
241
-
242
-
243
-
244
-
245
-
246
-
247
-
248
-
249
-
250
-
251
-
252
-
253
-
254
-
255
-
256
-
257
-
258
-
259
-
260
-
261
-
262
-
263
-
264
-
265
-
266
-
267
-
268
-
269
-
270
-
271
-
272
-
273
-
274
-
275
-
276
-
277
-
278
-
279
-
280
-
281
-
282
-
283
-
284
 |
 |

42 Bank of America 2012
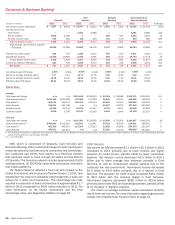
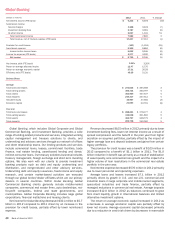
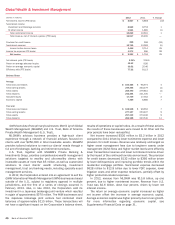
Global Banking
(Dollars in millions) 2012 2011 % Change
Net interest income (FTE basis) $ 9,225 $ 9,490 (3)%
Noninterest income:
Service charges 3,168 3,420 (7)
Investment banking fees 2,787 3,061 (9)
All other income 2,027 1,341 51
Total noninterest income 7,982 7,822 2
Total revenue, net of interest expense (FTE basis) 17,207 17,312 (1)
Provision for credit losses (103) (1,118) (91)
Noninterest expense 8,308 8,884 (6)
Income before income taxes 9,002 9,546 (6)
Income tax expense (FTE basis) 3,277 3,500 (6)
Net income $ 5,725 $ 6,046 (5)
Net interest yield (FTE basis) 3.01%3.26%
Return on average allocated equity 12.47 12.76
Return on average economic capital 27.21 26.59
Efficiency ratio (FTE basis) 48.28 51.31
Balance Sheet
Average
Total loans and leases $ 272,625 $ 265,568 3
Total earning assets 306,724 290,797 5
Total assets 352,969 337,337 5
Total deposits 249,317 237,312 5
Allocated equity 45,907 47,384 (3)
Economic capital 21,053 22,761 (8)
Year end
Total loans and leases $ 288,261 $ 278,177 4
Total earning assets 315,638 301,662 5
Total assets 362,797 348,773 4
Total deposits 269,738 246,360 9
Global Banking, which includes Global Corporate and Global
Commercial Banking, and Investment Banking, provides a wide
range of lending-related products and services, integrated working
capital management and treasury solutions to clients, and
underwriting and advisory services through our network of offices
and client relationship teams. Our lending products and services
include commercial loans, leases, commitment facilities, trade
finance, real estate lending, asset-based lending and direct/
indirect consumer loans. Our treasury solutions business includes
treasury management, foreign exchange and short-term investing
options. We also work with our clients to provide investment
banking products such as debt and equity underwriting and
distribution, and merger-related and other advisory services.
Underwriting debt and equity issuances, fixed-income and equity
research, and certain market-based activities are executed
through our global broker/dealer affiliates which are our primary
dealers in several countries. Within Global Banking, Global
Commercial Banking clients generally include middle-market
companies, commercial real estate firms, auto dealerships, not-
for-profit companies, federal and state governments, and
municipalities. Global Corporate Banking includes large global
corporations, financial institutions and leasing clients.
Net income for Global Banking decreased $321 million to $5.7
billion in 2012 compared to 2011 driven by an increase in the
provision for credit losses, partially offset by lower noninterest
expense.
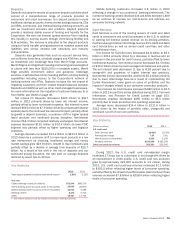
Revenue decreased $105 million in 2012 primarily due to lower
investment banking fees, lower net interest income as a result of
spread compression and the benefit in the prior year from higher
accretion on acquired portfolios, partially offset by the impact of
higher average loan and deposit balances and gains from certain
legacy portfolios.
The provision for credit losses was a benefit of $103 million in
2012 compared to a benefit of $1.1 billion in 2011. The $1.0
billion reduction in benefit was primarily as a result of stabilization
of asset quality, core commercial loan growth and the impact of a
higher volume of loan resolutions in the commercial real estate
portfolio in the prior year.
Noninterest expense decreased $576 million in 2012 primarily
due to lower personnel and operating expenses.
Average loans and leases increased $7.1 billion in 2012
primarily driven by growth in U.S. and non-U.S. commercial and
industrial loans in large corporate and middle-market segments,
specialized industries and trade finance, partially offset by
managed reductions in commercial real estate. Average deposits
increased $12.0 billion in 2012 as balances continued to grow
from client liquidity, growth in international balances and limited
alternative investment options.
The return on average economic capital increased in 2012 as
a decrease in average economic capital was partially offset by
lower net income. Average economic capital decreased primarily
due to a reduction in credit risk driven by decreases in reservable