Bank of America 2012 Annual Report Download - page 183
Download and view the complete annual report
Please find page 183 of the 2012 Bank of America annual report below. You can navigate through the pages in the report by either clicking on the pages listed below, or by using the keyword search tool below to find specific information within the annual report.-
 1
1 -
2
-
3
-
4
-
5
-
6
-
7
-
8
-
9
-
10
-
11
-
12
-
13
-
14
-
15
-
16
-
17
-
18
-
19
-
20
-
21
-
22
-
23
-
24
-
25
-
26
-
27
-
28
-
29
-
30
-
31
-
32
-
33
-
34
-
35
-
36
-
37
-
38
-
39
-
40
-
41
-
42
-
43
-
44
-
45
-
46
-
47
-
48
-
49
-
50
-
51
-
52
-
53
-
54
-
55
-
56
-
57
-
58
-
59
-
60
-
61
-
62
-
63
-
64
-
65
-
66
-
67
-
68
-
69
-
70
-
71
-
72
-
73
-
74
-
75
-
76
-
77
-
78
-
79
-
80
-
81
-
82
-
83
-
84
-
85
-
86
-
87
-
88
-
89
-
90
-
91
-
92
-
93
-
94
-
95
-
96
-
97
-
98
-
99
-
100
-
101
-
102
-
103
-
104
-
105
-
106
-
107
-
108
-
109
-
110
-
111
-
112
-
113
-
114
-
115
-
116
-
117
-
118
-
119
-
120
-
121
-
122
-
123
-
124
-
125
-
126
-
127
-
128
-
129
-
130
-
131
-
132
-
133
-
134
-
135
-
136
-
137
-
138
-
139
-
140
-
141
-
142
-
143
-
144
-
145
-
146
-
147
-
148
-
149
-
150
-
151
-
152
-
153
-
154
-
155
-
156
-
157
-
158
-
159
-
160
-
161
-
162
-
163
-
164
-
165
-
166
-
167
-
168
-
169
-
170
-
171
-
172
-
 173
173 -
 174
174 -
 175
175 -
 176
176 -
 177
177 -
 178
178 -
 179
179 -
 180
180 -
 181
181 -
 182
182 -
 183
183 -
 184
184 -
 185
185 -
 186
186 -
 187
187 -
 188
188 -
 189
189 -
 190
190 -
 191
191 -
 192
192 -
 193
193 -
194
-
195
-
196
-
197
-
198
-
199
-
200
-
201
-
202
-
203
-
204
-
205
-
206
-
207
-
208
-
209
-
210
-
211
-
212
-
213
-
214
-
215
-
216
-
217
-
218
-
219
-
220
-
221
-
222
-
223
-
224
-
225
-
226
-
227
-
228
-
229
-
230
-
231
-
232
-
233
-
234
-
235
-
236
-
237
-
238
-
239
-
240
-
241
-
242
-
243
-
244
-
245
-
246
-
247
-
248
-
249
-
250
-
251
-
252
-
253
-
254
-
255
-
256
-
257
-
258
-
259
-
260
-
261
-
262
-
263
-
264
-
265
-
266
-
267
-
268
-
269
-
270
-
271
-
272
-
273
-
274
-
275
-
276
-
277
-
278
-
279
-
280
-
281
-
282
-
283
-
284
 |
 |

Bank of America 2012 181
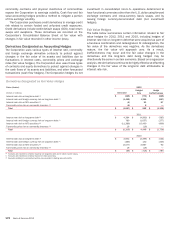
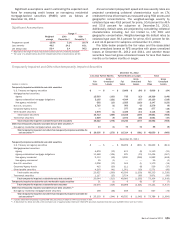
Significant assumptions used in estimating the expected cash
flows for measuring credit losses on non-agency residential
mortgage-backed securities (RMBS) were as follows at
December 31, 2012.
Significant Assumptions
Range
(1)
Weighted-
average
10th
Percentile (2)
90th
Percentile (2)
Prepayment speed 12.9% 3.1% 29.7%
Loss severity 49.5 24.2 63.1
Life default rate 52.4 2.4 98.2
(1) Represents the range of inputs/assumptions based upon the underlying collateral.
(2) The value of a variable below which the indicated percentile of observations will fall.
Annual constant prepayment speed and loss severity rates are
projected considering collateral characteristics such as LTV,
creditworthiness of borrowers as measured using FICO scores and
geographic concentrations. The weighted-average severity by
collateral type was 45.8 percent for prime, 50.6 percent for Alt-A
and 55.9 percent for subprime at December 31, 2012.
Additionally, default rates are projected by considering collateral
characteristics including, but not limited to, LTV, FICO and
geographic concentration. Weighted-average life default rates by
collateral type were 39.5 percent for prime, 63.5 percent for Alt-
A and 41.8 percent for subprime at December 31, 2012.
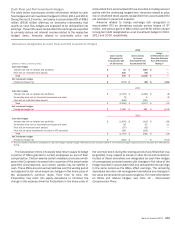
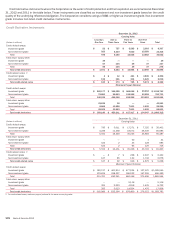
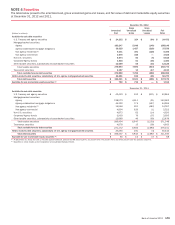
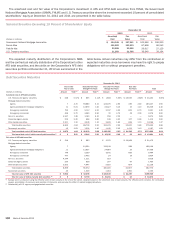
The table below presents the fair value and the associated
gross unrealized losses on AFS securities with gross unrealized
losses at December 31, 2012 and 2011, and whether these
securities have had gross unrealized losses for less than twelve
months or for twelve months or longer.
Temporarily Impaired and Other-than-temporarily Impaired Securities
December 31, 2012
Less than Twelve Months Twelve Months or Longer Total
(Dollars in millions)
Fair
Value
Gross
Unrealized
Losses
Fair
Value
Gross
Unrealized
Losses
Fair
Value
Gross
Unrealized
Losses
Temporarily impaired available-for-sale debt securities
U.S. Treasury and agency securities $ — $ — $ 5,608 $ (84) $ 5,608 $ (84)
Mortgage-backed securities:
Agency 15,593 (133) 735 (13) 16,328 (146)
Agency-collateralized mortgage obligations 5,135 (121) 4,994 (97) 10,129 (218)
Non-agency residential 592 (13) 1,555 (110) 2,147 (123)
Non-U.S. securities 1,715 (1) 563 (5) 2,278 (6)
Corporate/Agency bonds ——
277 (16) 277 (16)
Other taxable securities 1,678 (1) 1,436 (14) 3,114 (15)
Total taxable securities 24,713 (269) 15,168 (339)39,881 (608)
Tax-exempt securities 1,609 (9) 1,072 (38) 2,681 (47)
Total temporarily impaired available-for-sale debt securities 26,322 (278) 16,240 (377)42,562 (655)
Other-than-temporarily impaired available-for-sale debt securities (1)
Non-agency residential mortgage-backed securities 14 (1) 74 (4)88 (5)
Total temporarily impaired and other-than-temporarily impaired available-for-
sale securities (2) $ 26,336 $ (279) $ 16,314 $ (381)$ 42,650 $ (660)
December 31, 2011
Temporarily impaired available-for-sale debt securities
U.S. Treasury and agency securities $ — $ — $ 38,269 $ (811) $ 38,269 $ (811)
Mortgage-backed securities:
Agency 4,679 (13) 474 (8) 5,153 (21)
Agency-collateralized mortgage obligations 11,448 (134) 976 (33) 12,424 (167)
Non-agency residential 2,112 (59) 3,950 (350) 6,062 (409)
Non-agency commercial 55 (1) — — 55 (1)
Non-U.S. securities 1,008 (13) 165 (1) 1,173 (14)
Corporate/Agency bonds 415 (29) 111 (8) 526 (37)
Other taxable securities 4,210 (41) 1,361 (19) 5,571 (60)
Total taxable securities 23,927 (290) 45,306 (1,230) 69,233 (1,520)
Tax-exempt securities 1,117 (25) 2,754 (65) 3,871 (90)
Total temporarily impaired available-for-sale debt securities 25,044 (315) 48,060 (1,295) 73,104 (1,610)
Temporarily impaired available-for-sale marketable equity securities 31 (1) 6 (6) 37 (7)
Total temporarily impaired available-for-sale securities 25,075 (316) 48,066 (1,301) 73,141 (1,617)
Other-than-temporarily impaired available-for-sale debt securities (1)
Non-agency residential mortgage-backed securities 158 (28) 489 (45) 647 (73)
Total temporarily impaired and other-than-temporarily impaired available-for-
sale securities (2) $ 25,233 $ (344) $ 48,555 $ (1,346) $ 73,788 $ (1,690)
(1) Includes other-than-temporarily impaired AFS debt securities on which an OTTI loss remains in OCI.
(2) At December 31, 2012 and 2011, the amortized cost of approximately 2,600 and 3,800 AFS securities exceeded their fair value by $660 million and $1.7 billion.