Bank of America 2012 Annual Report Download - page 57
Download and view the complete annual report
Please find page 57 of the 2012 Bank of America annual report below. You can navigate through the pages in the report by either clicking on the pages listed below, or by using the keyword search tool below to find specific information within the annual report.-
 1
1 -
2
-
3
-
4
-
5
-
6
-
7
-
8
-
9
-
10
-
11
-
12
-
13
-
14
-
15
-
16
-
17
-
18
-
19
-
20
-
21
-
22
-
23
-
24
-
25
-
26
-
27
-
28
-
29
-
30
-
31
-
32
-
33
-
34
-
35
-
36
-
37
-
38
-
39
-
40
-
41
-
42
-
43
-
44
-
45
-
46
-
 47
47 -
 48
48 -
 49
49 -
 50
50 -
 51
51 -
 52
52 -
 53
53 -
 54
54 -
 55
55 -
 56
56 -
 57
57 -
 58
58 -
 59
59 -
 60
60 -
 61
61 -
 62
62 -
 63
63 -
 64
64 -
 65
65 -
 66
66 -
 67
67 -
68
-
69
-
70
-
71
-
72
-
73
-
74
-
75
-
76
-
77
-
78
-
79
-
80
-
81
-
82
-
83
-
84
-
85
-
86
-
87
-
88
-
89
-
90
-
91
-
92
-
93
-
94
-
95
-
96
-
97
-
98
-
99
-
100
-
101
-
102
-
103
-
104
-
105
-
106
-
107
-
108
-
109
-
110
-
111
-
112
-
113
-
114
-
115
-
116
-
117
-
118
-
119
-
120
-
121
-
122
-
123
-
124
-
125
-
126
-
127
-
128
-
129
-
130
-
131
-
132
-
133
-
134
-
135
-
136
-
137
-
138
-
139
-
140
-
141
-
142
-
143
-
144
-
145
-
146
-
147
-
148
-
149
-
150
-
151
-
152
-
153
-
154
-
155
-
156
-
157
-
158
-
159
-
160
-
161
-
162
-
163
-
164
-
165
-
166
-
167
-
168
-
169
-
170
-
171
-
172
-
173
-
174
-
175
-
176
-
177
-
178
-
179
-
180
-
181
-
182
-
183
-
184
-
185
-
186
-
187
-
188
-
189
-
190
-
191
-
192
-
193
-
194
-
195
-
196
-
197
-
198
-
199
-
200
-
201
-
202
-
203
-
204
-
205
-
206
-
207
-
208
-
209
-
210
-
211
-
212
-
213
-
214
-
215
-
216
-
217
-
218
-
219
-
220
-
221
-
222
-
223
-
224
-
225
-
226
-
227
-
228
-
229
-
230
-
231
-
232
-
233
-
234
-
235
-
236
-
237
-
238
-
239
-
240
-
241
-
242
-
243
-
244
-
245
-
246
-
247
-
248
-
249
-
250
-
251
-
252
-
253
-
254
-
255
-
256
-
257
-
258
-
259
-
260
-
261
-
262
-
263
-
264
-
265
-
266
-
267
-
268
-
269
-
270
-
271
-
272
-
273
-
274
-
275
-
276
-
277
-
278
-
279
-
280
-
281
-
282
-
283
-
284
 |
 |

Bank of America 2012 55
We and our subsidiaries have an established history of working
with the GSEs on repurchase claims. In 2012, we continued to
experience elevated levels of claims from FNMA, including claims
on loans on which borrowers have made a significant number of
payments (e.g., at least 25 payments) and, to a lesser extent,
loans that defaulted more than 18 months prior to the repurchase
request. The FNMA Settlement resolved substantially all of the
claims with respect to loans originated and sold to FNMA between
January 1, 2000 and December 31, 2008, as well as substantially
all future representations and warranties repurchase claims
associated with these loans.
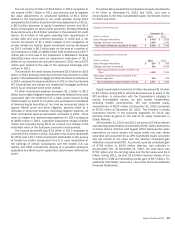
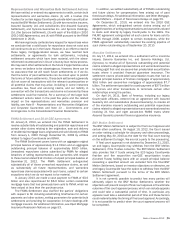
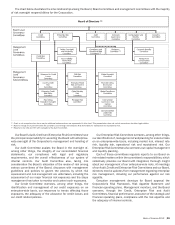
Table 11 highlights our experience with the GSEs related to
loans originated from 2004 through 2008.
Table 11 Overview of GSE Balances – 2004-2008 Originations
Legacy Originator
(Dollars in billions) Countrywide Other Total
Percent of
Total
Original funded balance $ 846 $ 272 $ 1,118
Principal payments (508) (177) (685)
Defaults (77) (14) (91)
Total outstanding balance at December 31, 2012 $ 261 $ 81 $ 342
Outstanding principal balance 180 days or more past due (severely delinquent) $ 34 $ 8 $42
Defaults plus severely delinquent 111 22 133
Payments made by borrower
Less than 13
$15 11%
13-24
31 23
25-36
34 26
More than 36
53 40
Total payments made by borrower
$133 100%
Unresolved GSE representations and warranties repurchase claims (all vintages)
As of December 31, 2011
$ 6.2
As of December 31, 2012
13.5
As of December 31, 2012 (pro forma reflecting the FNMA Settlement) 1.3
Cumulative GSE representations and warranties losses (2004-2008 vintages)
9.8
Beginning in February 2012, we stopped delivering purchase
money and non-Making Home Affordable (MHA) refinance first-lien
residential mortgage products into FNMA MBS pools because of
the expiration and mutual non-renewal of certain contractual
delivery commitments and variances that permit efficient delivery
of such loans to FNMA. While we continue to have a valid agreement
with FNMA permitting the delivery of purchase money and non-
MHA refinance first-lien residential mortgage products without
such contractual variances, the delivery of such products without
contractual delivery commitments and variances would involve
time and expense to implement the necessary operational and
systems changes and otherwise presents practical operational
issues. We do not expect this change to have a material impact
on our CRES business, as we expect to rely on other sources of
liquidity to actively extend mortgage credit to our customers
including continuing to deliver such products into FHLMC MBS
pools. Additionally, we continue to deliver MHA refinancing
products into FNMA MBS pools.
Experience with Investors Other than Government-
sponsored Enterprises
In prior years, legacy companies and certain subsidiaries sold
pools of first-lien mortgage loans and home equity loans as private-
label securitizations or in the form of whole loans originated from
2004 through 2008 with an original principal balance of $963
billion to investors other than GSEs (although the GSEs are
investors in certain private-label securitizations), of which
approximately $530 billion in principal has been paid and $244
billion has defaulted or is severely delinquent at December 31,
2012.
As it relates to private-label securitizations, a contractual
liability to repurchase mortgage loans generally arises only if
counterparties prove there is a breach of the representations and
warranties that materially and adversely affects the interest of the
investor or all investors in a securitization trust or of the monoline
insurer or other financial guarantor (as applicable). We believe that
the longer a loan performs, the less likely it is that an alleged
representations and warranties breach had a material impact on
the loan’s performance or that a breach even exists. Because the
majority of the borrowers in this population would have made a
significant number of payments if they are not yet 180 days or
more past due, we believe that the principal balance at the greatest
risk for repurchase claims in this population of private-label
securitizations are loans that have already defaulted and those
that are currently severely delinquent. Additionally, only
counterparties with the contractual right to demand repurchase of
a loan can present valid repurchase claims (in the case of private-
label securitization trust investors, they generally have to meet
certain contractual thresholds in order to require trustees to
present repurchase claims). While we believe the agreements for
private-label securitizations generally contain less rigorous
representations and warranties and place higher burdens on
investors seeking repurchases than the explicit provisions of the
comparable agreements with the GSEs without regard to any
variations that may have arisen as a result of dealings with the
GSEs, the agreements generally include a representation that
underwriting practices were prudent and customary.
Any amounts paid related to repurchase claims from a monoline
insurer are paid to the securitization trust and are applied in
accordance with the terms of the governing securitization
documents, which may include use by the securitization trust to
repay any outstanding monoline advances or reduce future
advances from the monolines. To the extent that a monoline has