Bank of America 2012 Annual Report Download - page 265
Download and view the complete annual report
Please find page 265 of the 2012 Bank of America annual report below. You can navigate through the pages in the report by either clicking on the pages listed below, or by using the keyword search tool below to find specific information within the annual report.-
 1
1 -
2
-
3
-
4
-
5
-
6
-
7
-
8
-
9
-
10
-
11
-
12
-
13
-
14
-
15
-
16
-
17
-
18
-
19
-
20
-
21
-
22
-
23
-
24
-
25
-
26
-
27
-
28
-
29
-
30
-
31
-
32
-
33
-
34
-
35
-
36
-
37
-
38
-
39
-
40
-
41
-
42
-
43
-
44
-
45
-
46
-
47
-
48
-
49
-
50
-
51
-
52
-
53
-
54
-
55
-
56
-
57
-
58
-
59
-
60
-
61
-
62
-
63
-
64
-
65
-
66
-
67
-
68
-
69
-
70
-
71
-
72
-
73
-
74
-
75
-
76
-
77
-
78
-
79
-
80
-
81
-
82
-
83
-
84
-
85
-
86
-
87
-
88
-
89
-
90
-
91
-
92
-
93
-
94
-
95
-
96
-
97
-
98
-
99
-
100
-
101
-
102
-
103
-
104
-
105
-
106
-
107
-
108
-
109
-
110
-
111
-
112
-
113
-
114
-
115
-
116
-
117
-
118
-
119
-
120
-
121
-
122
-
123
-
124
-
125
-
126
-
127
-
128
-
129
-
130
-
131
-
132
-
133
-
134
-
135
-
136
-
137
-
138
-
139
-
140
-
141
-
142
-
143
-
144
-
145
-
146
-
147
-
148
-
149
-
150
-
151
-
152
-
153
-
154
-
155
-
156
-
157
-
158
-
159
-
160
-
161
-
162
-
163
-
164
-
165
-
166
-
167
-
168
-
169
-
170
-
171
-
172
-
173
-
174
-
175
-
176
-
177
-
178
-
179
-
180
-
181
-
182
-
183
-
184
-
185
-
186
-
187
-
188
-
189
-
190
-
191
-
192
-
193
-
194
-
195
-
196
-
197
-
198
-
199
-
200
-
201
-
202
-
203
-
204
-
205
-
206
-
207
-
208
-
209
-
210
-
211
-
212
-
213
-
214
-
215
-
216
-
217
-
218
-
219
-
220
-
221
-
222
-
223
-
224
-
225
-
226
-
227
-
228
-
229
-
230
-
231
-
232
-
233
-
234
-
235
-
236
-
237
-
238
-
239
-
240
-
241
-
242
-
243
-
244
-
245
-
246
-
247
-
248
-
249
-
250
-
251
-
252
-
253
-
254
-
 255
255 -
 256
256 -
 257
257 -
 258
258 -
 259
259 -
 260
260 -
 261
261 -
 262
262 -
 263
263 -
 264
264 -
 265
265 -
 266
266 -
 267
267 -
 268
268 -
 269
269 -
 270
270 -
 271
271 -
 272
272 -
 273
273 -
 274
274 -
 275
275 -
276
-
277
-
278
-
279
-
280
-
281
-
282
-
283
-
284
 |
 |

Bank of America 2012 263
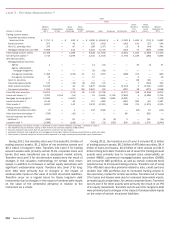
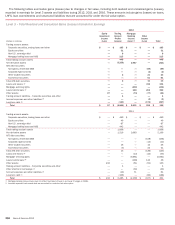
Level 3 – Changes in Unrealized Gains (Losses) Relating to Assets and Liabilities Still Held at Reporting Date
2010
(Dollars in millions)
Equity
Investment
Income
(Loss)
Trading
Account
Profits
(Losses)
Mortgage
Banking
Income
(Loss) (1)
Other
Income
(Loss) Total
Trading account assets:
Corporate securities, trading loans and other $ — $ 289 $ — $ — $ 289
Equity securities — (50) — — (50)
Non-U.S. sovereign debt — (144) — — (144)
Mortgage trading loans and ABS — 227 — — 227
Total trading account assets — 322 — — 322
Net derivative assets — (945) 676 — (269)
Non-agency residential MBS AFS debt securities — — (2) (162) (164)
Loans and leases (2) — — — (142) (142)
Mortgage servicing rights — — (5,740) — (5,740)
Loans held-for-sale (2) —10(9) 258 259
Other assets 50 — (22) — 28
Trading account liabilities – Non-U.S. sovereign debt — 52 — — 52
Other short-term borrowings (2) — — (46) — (46)
Accrued expenses and other liabilities (2) — — — (182) (182)
Long-term debt (2) — 585 — 43 628
Total $ 50 $ 24 $ (5,143) $ (185) $ (5,254)
(1) Mortgage banking income (loss) does not reflect the impact of Level 1 and Level 2 hedges on MSRs.
(2) Amounts represent instruments that are accounted for under the fair value option.
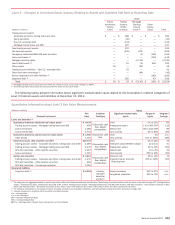
The following tables present information about significant unobservable inputs related to the Corporation’s material categories of
Level 3 financial assets and liabilities at December 31, 2012.
Quantitative Information about Level 3 Fair Value Measurements
(Dollars in millions) Inputs
Financial Instrument
Fair
Value
Valuation
Technique
Significant Unobservable
Inputs
Ranges of
Inputs
Weighted
Average
Loans and Securities (1)
Instruments backed by residential real estate assets $ 4,478 Discounted cash
flow, Market
comparables
Yield 2% to 25% 6%
Trading account assets – Mortgage trading loans and ABS 459 Prepayment speed 1% to 30% CPR 11%
Loans and leases 1,286 Default rate 0% to 44% CDR 8%
Loans held-for-sale 2,733 Loss severity 6% to 85% 36%
Instruments backed by commercial real estate assets $ 1,910 Discounted cash
flow
Yield 5% n/a
Other assets 1,910 Loss severity 51% to 100% 88%
Commercial loans, debt securities and other $10,778
Discounted cash
flow, Market
comparables
Yield 0% to 25% 4%
Trading account assets – Corporate securities, trading loans and other 2,289 Enterprise value/EBITDA multiple 2x to 11x 5x
Trading account assets – Mortgage trading loans and ABS 4,476 Prepayment speed 5% to 30% 20%
AFS debt securities – Other taxable securities 3,012 Default rate 1% to 5% 4%
Loans and leases 1,001 Loss severity 25% to 40% 35%
Auction rate securities $ 3,414 Discounted cash
flow, Market
comparables
Discount rate 0% to 10% 4%
Trading account assets – Corporate securities, trading loans and other 1,437 Projected tender price/Re-
financing level
50% to 100% 92%
AFS debt securities – Other taxable securities 916
AFS debt securities – Tax-exempt securities 1,061
Structured liabilities
Long-term debt (2) $(2,301)Industry
standard
derivative
pricing (3)
Equity correlation 30% to 97% n/m
Long-dated volatilities 20% to 70% n/m
(1) The categories are aggregated based on product type which differs from financial statement classification. The following is a reconciliation to the line items in the table on page 257: Trading account
assets – Corporate securities, trading loans and other of $3.7 billion, Trading account assets – Mortgage trading loans and ABS of $4.9 billion, AFS debt securities – Other taxable securities of $3.9
billion, AFS debt securities – Tax-exempt securities of $1.1 billion, Loans and leases of $2.3 billion, LHFS of $2.7 billion and Other assets of $1.9 billion.
(2) For additional information on the ranges of inputs for equity correlation and long-dated volatilities, see the qualitative equity derivatives discussion on page 264.
(3) Includes models such as Monte Carlo simulation and Black-Scholes.
n/a = not applicable
n/m = not meaningful
CPR = Constant Prepayment Rate
CDR = Constant Default Rate
EBITDA = Earnings before interest, taxes, depreciation and amortization