Bank of America 2012 Annual Report Download - page 86
Download and view the complete annual report
Please find page 86 of the 2012 Bank of America annual report below. You can navigate through the pages in the report by either clicking on the pages listed below, or by using the keyword search tool below to find specific information within the annual report.-
 1
1 -
2
-
3
-
4
-
5
-
6
-
7
-
8
-
9
-
10
-
11
-
12
-
13
-
14
-
15
-
16
-
17
-
18
-
19
-
20
-
21
-
22
-
23
-
24
-
25
-
26
-
27
-
28
-
29
-
30
-
31
-
32
-
33
-
34
-
35
-
36
-
37
-
38
-
39
-
40
-
41
-
42
-
43
-
44
-
45
-
46
-
47
-
48
-
49
-
50
-
51
-
52
-
53
-
54
-
55
-
56
-
57
-
58
-
59
-
60
-
61
-
62
-
63
-
64
-
65
-
66
-
67
-
68
-
69
-
70
-
71
-
72
-
73
-
74
-
75
-
 76
76 -
 77
77 -
 78
78 -
 79
79 -
 80
80 -
 81
81 -
 82
82 -
 83
83 -
 84
84 -
 85
85 -
 86
86 -
 87
87 -
 88
88 -
 89
89 -
 90
90 -
 91
91 -
 92
92 -
 93
93 -
 94
94 -
 95
95 -
 96
96 -
97
-
98
-
99
-
100
-
101
-
102
-
103
-
104
-
105
-
106
-
107
-
108
-
109
-
110
-
111
-
112
-
113
-
114
-
115
-
116
-
117
-
118
-
119
-
120
-
121
-
122
-
123
-
124
-
125
-
126
-
127
-
128
-
129
-
130
-
131
-
132
-
133
-
134
-
135
-
136
-
137
-
138
-
139
-
140
-
141
-
142
-
143
-
144
-
145
-
146
-
147
-
148
-
149
-
150
-
151
-
152
-
153
-
154
-
155
-
156
-
157
-
158
-
159
-
160
-
161
-
162
-
163
-
164
-
165
-
166
-
167
-
168
-
169
-
170
-
171
-
172
-
173
-
174
-
175
-
176
-
177
-
178
-
179
-
180
-
181
-
182
-
183
-
184
-
185
-
186
-
187
-
188
-
189
-
190
-
191
-
192
-
193
-
194
-
195
-
196
-
197
-
198
-
199
-
200
-
201
-
202
-
203
-
204
-
205
-
206
-
207
-
208
-
209
-
210
-
211
-
212
-
213
-
214
-
215
-
216
-
217
-
218
-
219
-
220
-
221
-
222
-
223
-
224
-
225
-
226
-
227
-
228
-
229
-
230
-
231
-
232
-
233
-
234
-
235
-
236
-
237
-
238
-
239
-
240
-
241
-
242
-
243
-
244
-
245
-
246
-
247
-
248
-
249
-
250
-
251
-
252
-
253
-
254
-
255
-
256
-
257
-
258
-
259
-
260
-
261
-
262
-
263
-
264
-
265
-
266
-
267
-
268
-
269
-
270
-
271
-
272
-
273
-
274
-
275
-
276
-
277
-
278
-
279
-
280
-
281
-
282
-
283
-
284
 |
 |
84 Bank of America 2012
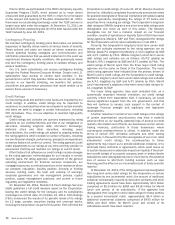
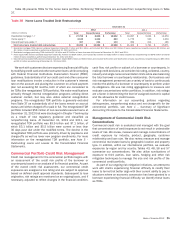
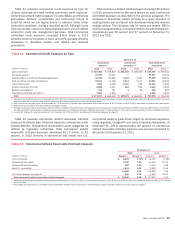
These additions to nonperforming loans were partially offset
by the $435 million of loans forgiven related to the National
Mortgage Settlement. Excluding the impact of these items,
nonperforming loans increased compared to December 31, 2011
as inflows outpaced outflows in 2012. At December 31, 2012, on
$2.0 billion, or 46 percent of nonperforming home equity loans,
the borrowers were current on contractual payments and $1.2
billion, or 28 percent of nonperforming home equity loans, were
180 days or more past due and had been written down to the
estimated fair value of the collateral less estimated costs to sell.
Outstanding balances accruing past due 30 days or more
decreased $560 million during 2012 driven in part by the
reclassification of junior-lien home equity loans to nonperforming
in accordance with regulatory interagency guidance. For more
information on the changes as a result of regulatory guidance and
the National Mortgage Settlement, see Consumer Portfolio Credit
Risk Management on page 76.
In some cases, the junior-lien home equity outstanding balance
that we hold is performing, but the underlying first-lien is not. For
outstanding balances in the home equity portfolio in which we
service the first-lien loan, we are able to track whether the first-
lien loan is in default. For loans where the first-lien is serviced by
a third party, we utilize credit bureau data to estimate the
delinquency status of the first-lien. Given that the credit bureau
database we use does not include a property address for the
mortgages, we are unable to identify with certainty whether a
reported delinquent first-lien mortgage pertains to the same
property for which we hold a junior-lien loan. At December 31,
2012, we estimate that $2.6 billion of current and $559 million
of 30 to 89 days past due junior-lien loans were behind a delinquent
first-lien loan. We service the first-lien loans on $958 million of
these combined amounts, with the remaining $2.2 billion serviced
by third parties. Of the $3.2 billion current to 89 days past due
junior-lien loans, based on available credit bureau data and our
own internal servicing data, we estimate that approximately $1.5
billion had first-lien loans that were 90 days or more past due.
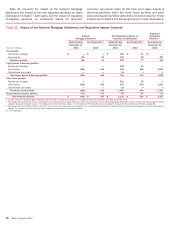
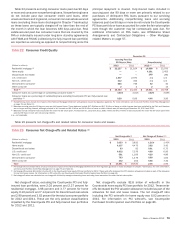
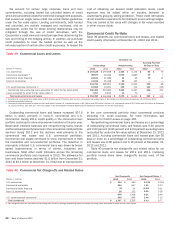
Net charge-offs decreased $236 million to $4.2 billion, or 3.98
percent of the total average home equity portfolio, for 2012
compared to $4.5 billion, or 3.77 percent, for 2011 primarily driven
by favorable portfolio trends due in part to improvement in the
U.S. economy partially offset by $435 million in net charge-offs
associated with the National Mortgage Settlement and $474
million in net charge-offs related to loans discharged in Chapter
7 bankruptcy that were written down to the underlying collateral
value due to new regulatory guidance. Net charge-off ratios were
further impacted by lower outstanding balances primarily as a
result of paydowns and charge-offs outpacing new originations and
draws on existing lines.
There are certain characteristics of the home equity portfolio
that have contributed to higher losses including those loans with
a high refreshed combined loan-to-value (CLTV), loans that were
originated at the peak of home prices in 2006 and 2007, and
loans in geographic areas that have experienced the most
significant declines in home prices. Home price declines coupled
with the fact that most home equity outstandings are secured by
second-lien positions have significantly reduced and, in some
cases, eliminated all collateral value after consideration of the
first-lien position. Although the disclosures in this section address
each of these risk characteristics separately, there is significant
overlap in outstanding balances with these characteristics, which
has contributed to a disproportionate share of losses in the
portfolio. Outstanding balances in the home equity portfolio with
all of these higher risk characteristics comprised eight percent
and 10 percent of the total home equity portfolio at December 31,
2012 and 2011, and accounted for 24 percent of the home equity
net charge-offs in 2012 compared to 28 percent in 2011.
Outstanding balances in the home equity portfolio with greater
than 90 percent but less than 100 percent refreshed CLTVs
comprised 10 percent and 11 percent of the home equity portfolio
at December 31, 2012 and 2011. Outstanding balances with
refreshed CLTVs greater than 100 percent comprised 29 percent
and 32 percent of the home equity portfolio at December 31, 2012
and 2011. Outstanding balances in the home equity portfolio with
a refreshed CLTV greater than 100 percent reflect loans where the
carrying value and available line of credit of the combined loans
are equal to or greater than the most recent valuation of the
property securing the loan. Depending on the value of the property,
there may be collateral in excess of the first-lien that is available
to reduce the severity of loss on the second-lien. Home price
deterioration over the past several years has contributed to an
increase in CLTV ratios. Of those outstanding balances with a
refreshed CLTV greater than 100 percent, 95 percent of the
customers were current at December 31, 2012 and 92 percent
of second-lien loans with a refreshed CLTV greater than 100
percent were current on both their second-lien and underlying first-
lien loans at December 31, 2012. Outstanding balances in the
home equity portfolio to borrowers with a refreshed FICO score
below 620 represented eight percent and nine percent of the home
equity portfolio at December 31, 2012 and 2011.
Of the $99.4 billion and $112.7 billion in total home equity
portfolio outstandings at December 31, 2012 and 2011,
79 percent and 78 percent were interest-only loans, almost all of
which were HELOCs. The outstanding balance of HELOCs that have
entered the amortization period was $2.1 billion, or two percent
of total HELOCs, at December 31, 2012. The HELOCs that have
entered the amortization period have experienced a higher
percentage of early stage delinquencies and nonperforming status
when compared to the HELOC portfolio as a whole. As of
December 31, 2012, $72 million, or three percent of outstanding
HELOCs that had entered the amortization period were accruing
past due 30 days or more compared to $972 million, or one
percent of outstanding accruing past due 30 days or more for the
entire HELOC portfolio. In addition, at December 31, 2012, $131
million, or six percent of outstanding HELOCs that had entered the
amortization period were nonperforming compared to $3.7 billion,
or four percent of outstandings that were nonperforming for the
entire HELOC portfolio. Loans in our HELOC portfolio generally
have an initial draw period of 10 years and more than 85 percent
of these loans will not be required to make a fully-amortizing
payment until 2015 or later.
Although we do not actively track how many of our home equity
customers pay only the minimum amount due on their home equity
loans and lines, we can infer some of this information through a
review of our HELOC portfolio that we service and that is still in
its revolving period (i.e., customers may draw on and repay their
line of credit, but are generally only required to pay interest on a
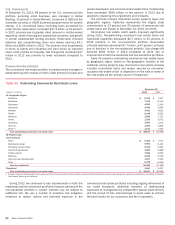
monthly basis). During 2012, approximately 50 percent of these
customers did not pay any principal on their HELOCs.
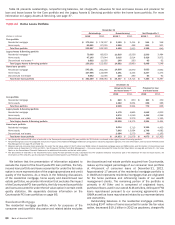
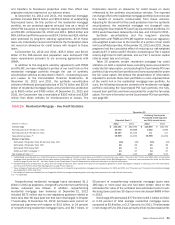
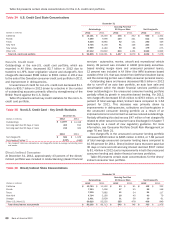
Table 28 presents outstandings, nonperforming balances and
net charge-offs by certain state concentrations for the home equity
portfolio. In the New York area, the New York-Northern New Jersey-
Long Island MSA made up 11 percent of the outstanding home
equity portfolio at both December 31, 2012 and 2011. This MSA
comprised eight percent and seven percent of net charge-offs in