Bank of America 2012 Annual Report Download - page 194
Download and view the complete annual report
Please find page 194 of the 2012 Bank of America annual report below. You can navigate through the pages in the report by either clicking on the pages listed below, or by using the keyword search tool below to find specific information within the annual report.-
 1
1 -
2
-
3
-
4
-
5
-
6
-
7
-
8
-
9
-
10
-
11
-
12
-
13
-
14
-
15
-
16
-
17
-
18
-
19
-
20
-
21
-
22
-
23
-
24
-
25
-
26
-
27
-
28
-
29
-
30
-
31
-
32
-
33
-
34
-
35
-
36
-
37
-
38
-
39
-
40
-
41
-
42
-
43
-
44
-
45
-
46
-
47
-
48
-
49
-
50
-
51
-
52
-
53
-
54
-
55
-
56
-
57
-
58
-
59
-
60
-
61
-
62
-
63
-
64
-
65
-
66
-
67
-
68
-
69
-
70
-
71
-
72
-
73
-
74
-
75
-
76
-
77
-
78
-
79
-
80
-
81
-
82
-
83
-
84
-
85
-
86
-
87
-
88
-
89
-
90
-
91
-
92
-
93
-
94
-
95
-
96
-
97
-
98
-
99
-
100
-
101
-
102
-
103
-
104
-
105
-
106
-
107
-
108
-
109
-
110
-
111
-
112
-
113
-
114
-
115
-
116
-
117
-
118
-
119
-
120
-
121
-
122
-
123
-
124
-
125
-
126
-
127
-
128
-
129
-
130
-
131
-
132
-
133
-
134
-
135
-
136
-
137
-
138
-
139
-
140
-
141
-
142
-
143
-
144
-
145
-
146
-
147
-
148
-
149
-
150
-
151
-
152
-
153
-
154
-
155
-
156
-
157
-
158
-
159
-
160
-
161
-
162
-
163
-
164
-
165
-
166
-
167
-
168
-
169
-
170
-
171
-
172
-
173
-
174
-
175
-
176
-
177
-
178
-
179
-
180
-
181
-
182
-
183
-
 184
184 -
 185
185 -
 186
186 -
 187
187 -
 188
188 -
 189
189 -
 190
190 -
 191
191 -
 192
192 -
 193
193 -
 194
194 -
 195
195 -
 196
196 -
 197
197 -
 198
198 -
 199
199 -
 200
200 -
 201
201 -
 202
202 -
 203
203 -
 204
204 -
205
-
206
-
207
-
208
-
209
-
210
-
211
-
212
-
213
-
214
-
215
-
216
-
217
-
218
-
219
-
220
-
221
-
222
-
223
-
224
-
225
-
226
-
227
-
228
-
229
-
230
-
231
-
232
-
233
-
234
-
235
-
236
-
237
-
238
-
239
-
240
-
241
-
242
-
243
-
244
-
245
-
246
-
247
-
248
-
249
-
250
-
251
-
252
-
253
-
254
-
255
-
256
-
257
-
258
-
259
-
260
-
261
-
262
-
263
-
264
-
265
-
266
-
267
-
268
-
269
-
270
-
271
-
272
-
273
-
274
-
275
-
276
-
277
-
278
-
279
-
280
-
281
-
282
-
283
-
284
 |
 |

192 Bank of America 2012
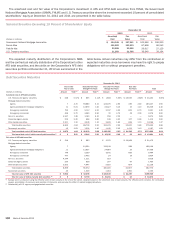
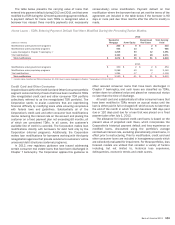
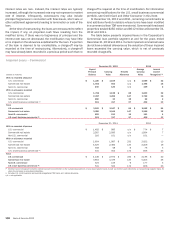
The table below presents the December 31, 2012 and 2011
unpaid principal balance, carrying value, and average pre- and post-
modification interest rates of home loans that were modified in
TDRs during 2012 and 2011, and net charge-offs that were
recorded during the period in which the modification occurred. The
following Home Loans portfolio segment tables include loans that
were initially classified as TDRs during the period and also loans
that had previously been classified as TDRs and were modified
again during the period. These TDRs are managed by Legacy
Assets & Servicing.
Home Loans – TDRs Entered into During 2012 and 2011 (1)
December 31, 2012 2012
(Dollars in millions)
Unpaid
Principal
Balance
Carrying
Value
Pre-
modification
Interest Rate
Post-
modification
Interest Rate
Net Charge-
offs
Residential mortgage $ 14,929 $ 12,143 5.52%4.70% $ 507
Home equity 1,721 858 5.22 4.39 716
Discontinued real estate 159 85 5.21 4.35 16
Total $ 16,809 $ 13,086 5.49 4.66 $ 1,239
December 31, 2011 2011
Residential mortgage $ 11,623 $ 9,903 5.94% 5.16% $ 299
Home equity 1,112 556 6.58 5.25 239
Discontinued real estate 141 88 6.68 5.08 9
Total $ 12,876 $ 10,547 6.01 5.17 $ 547
(1) TDRs entered into during 2012 include principal forgiveness as follows: residential mortgage modifications of $755 million, home equity modifications of $9 million and discontinued real estate
modifications of $23 million. Prior to 2012, the principal forgiveness amount was not significant.
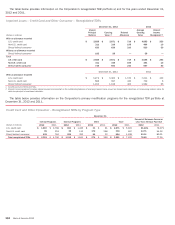
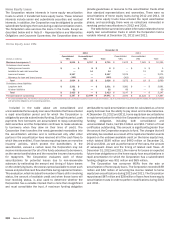
The table below presents the December 31, 2012 and 2011 carrying value for home loans that were modified in TDRs during 2012
and 2011 by type of modification.
Home Loans – Modification Programs
TDRs Entered into During 2012
(Dollars in millions)
Residential
Mortgage Home Equity
Discontinued
Real Estate
Total Carrying
Value
Modifications under government programs
Contractual interest rate reduction $638 $ 78 $ 4 $ 720
Principal and/or interest forbearance 49 31 2 82
Other modifications (1) 37 1 —38
Total modifications under government programs 724 110 6 840
Modifications under proprietary programs
Contractual interest rate reduction 3,343 44 7 3,394
Capitalization of past due amounts 143 — 1 144
Principal and/or interest forbearance 415 16 9 440
Other modifications (1) 97 21 —118
Total modifications under proprietary programs 3,998 81 17 4,096
Trial modifications 4,505 69 42 4,616
Loans discharged in Chapter 7 bankruptcy (2) 2,916 598 20 3,534
Total modifications $ 12,143 $ 858 $85 $ 13,086
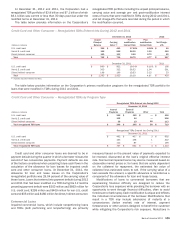
TDRs Entered into During 2011
Modifications under government programs
Contractual interest rate reduction $ 984 $ 189 $ 10 $ 1,183
Principal and/or interest forbearance 187 36 2 225
Other modifications (1) 64 5 — 69
Total modifications under government programs 1,235 230 12 1,477
Modifications under proprietary programs
Contractual interest rate reduction 3,508 101 23 3,632
Capitalization of past due amounts 408 1 2 411
Principal and/or interest forbearance 936 49 10 995
Other modifications (1) 439 34 2 475
Total modifications under proprietary programs 5,291 185 37 5,513
Trial modifications 3,377 141 39 3,557
Total modifications $ 9,903 $ 556 $ 88 $ 10,547
(1) Includes other modifications such as term or payment extensions and repayment plans.
(2) Includes loans newly classified as TDRs in accordance with new regulatory guidance on loans discharged in Chapter 7 bankruptcy that was issued in 2012.