Bank of America 2012 Annual Report Download - page 25
Download and view the complete annual report
Please find page 25 of the 2012 Bank of America annual report below. You can navigate through the pages in the report by either clicking on the pages listed below, or by using the keyword search tool below to find specific information within the annual report.-
 1
1 -
2
-
3
-
4
-
5
-
6
-
7
-
8
-
9
-
10
-
11
-
12
-
13
-
14
-
 15
15 -
 16
16 -
 17
17 -
 18
18 -
 19
19 -
 20
20 -
 21
21 -
 22
22 -
 23
23 -
 24
24 -
 25
25 -
 26
26 -
 27
27 -
 28
28 -
 29
29 -
 30
30 -
 31
31 -
 32
32 -
 33
33 -
 34
34 -
 35
35 -
36
-
37
-
38
-
39
-
40
-
41
-
42
-
43
-
44
-
45
-
46
-
47
-
48
-
49
-
50
-
51
-
52
-
53
-
54
-
55
-
56
-
57
-
58
-
59
-
60
-
61
-
62
-
63
-
64
-
65
-
66
-
67
-
68
-
69
-
70
-
71
-
72
-
73
-
74
-
75
-
76
-
77
-
78
-
79
-
80
-
81
-
82
-
83
-
84
-
85
-
86
-
87
-
88
-
89
-
90
-
91
-
92
-
93
-
94
-
95
-
96
-
97
-
98
-
99
-
100
-
101
-
102
-
103
-
104
-
105
-
106
-
107
-
108
-
109
-
110
-
111
-
112
-
113
-
114
-
115
-
116
-
117
-
118
-
119
-
120
-
121
-
122
-
123
-
124
-
125
-
126
-
127
-
128
-
129
-
130
-
131
-
132
-
133
-
134
-
135
-
136
-
137
-
138
-
139
-
140
-
141
-
142
-
143
-
144
-
145
-
146
-
147
-
148
-
149
-
150
-
151
-
152
-
153
-
154
-
155
-
156
-
157
-
158
-
159
-
160
-
161
-
162
-
163
-
164
-
165
-
166
-
167
-
168
-
169
-
170
-
171
-
172
-
173
-
174
-
175
-
176
-
177
-
178
-
179
-
180
-
181
-
182
-
183
-
184
-
185
-
186
-
187
-
188
-
189
-
190
-
191
-
192
-
193
-
194
-
195
-
196
-
197
-
198
-
199
-
200
-
201
-
202
-
203
-
204
-
205
-
206
-
207
-
208
-
209
-
210
-
211
-
212
-
213
-
214
-
215
-
216
-
217
-
218
-
219
-
220
-
221
-
222
-
223
-
224
-
225
-
226
-
227
-
228
-
229
-
230
-
231
-
232
-
233
-
234
-
235
-
236
-
237
-
238
-
239
-
240
-
241
-
242
-
243
-
244
-
245
-
246
-
247
-
248
-
249
-
250
-
251
-
252
-
253
-
254
-
255
-
256
-
257
-
258
-
259
-
260
-
261
-
262
-
263
-
264
-
265
-
266
-
267
-
268
-
269
-
270
-
271
-
272
-
273
-
274
-
275
-
276
-
277
-
278
-
279
-
280
-
281
-
282
-
283
-
284
 |
 |

Bank of America 2012 23
At December 31, 2012, we included a positive $342 million in
the valuation of our MSRs based on information in the offers we
had received on portions of our MSR portfolio. We will recognize
as gain on sale any additional increases over the book value of
the MSR asset in future periods at the time of the servicing
transfers. Our ability to recognize such expected additional
increases is subject to the consummation of these servicing
transfers and the amount of such benefit will be dependent upon
certain factors such as interest rates.
Capital and Liquidity Related Matters
In the fourth quarter of 2012, we repurchased certain of our debt
and trust preferred securities with an aggregate carrying value of
$5.2 billion for $5.3 billion in cash resulting in a loss of $110
million upon redemption, partially offset by a related pre-tax net
interest income benefit of $57 million. We expect that these
liability management actions will result in a pre-tax net interest
income benefit of approximately $350 million in 2013.
We may conduct additional redemptions, tender offers,
exercises and other transactions in the future depending on
prevailing market conditions, capital, liquidity and other factors.
Performance Overview
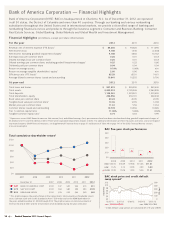
Net income was $4.2 billion, or $0.25 per diluted share in 2012
compared to $1.4 billion, or $0.01 per diluted share in 2011.
Net interest income on a fully taxable-equivalent (FTE) basis
decreased $4.0 billion to $41.6 billion for 2012 compared to
2011. The most significant driver of the decline was lower
consumer loan balances and yields partially offset by ongoing
reductions in long-term debt.
Noninterest income decreased $6.2 billion to $42.7 billion.
The most significant drivers of the decline included a decrease of
$5.3 billion in equity investment income, negative fair value
adjustments of $5.1 billion on structured liabilities in 2012
compared to positive fair value adjustments of $3.3 billion in 2011
and debit valuation adjustment (DVA) losses on derivatives of $2.5
billion, net of hedges, compared to DVA gains on derivatives of
$1.0 billion, net of hedges, in 2012 and 2011, respectively. These
declines were partially offset by significantly lower representations
and warranties provision of $3.9 billion in 2012 compared to $15.6
billion in 2011.
The provision for credit losses decreased $5.2 billion in 2012
to $8.2 billion. The decline was primarily in the home loans
portfolio due to improved portfolio trends and increasing home
prices.
Noninterest expense decreased $8.2 billion to $72.1 billion.
The most significant drivers of the decline were the absence of
goodwill impairment charges in 2012 compared to $3.2 billion in
2011, and declines of $1.4 billion and $1.3 billion in litigation and
personnel expenses, respectively. These declines were partially
offset by a provision of $1.1 billion in 2012 related to the 2013
IFR Acceleration Agreement.
Included in the income tax benefit for 2012 was a $1.7 billion
tax benefit related to the recognition of certain foreign tax credits.
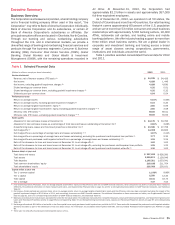
For summary information on the Corporation’s results, see
Executive Summary – Financial Highlights below and Business
Segment Results on page 28.
Table 2 Summary Income Statement
(Dollars in millions) 2012 2011
Net interest income (FTE basis) (1) $ 41,557 $ 45,588
Noninterest income 42,678 48,838
Total revenue, net of interest expense (FTE basis) (1) 84,235 94,426
Provision for credit losses 8,169 13,410
Goodwill impairment —3,184
All other noninterest expense 72,093 77,090
Income before income taxes 3,973 742
Income tax benefit (FTE basis) (1) (215) (704)
Net income 4,188 1,446
Preferred stock dividends 1,428 1,361
Net income applicable to common shareholders $ 2,760 $ 85
Per common share information
Earnings $ 0.26 $ 0.01
Diluted earnings 0.25 0.01
(1) FTE basis is a non-GAAP financial measure. For additional information on this measure, see
Supplemental Financial Data on page 31, and for a corresponding reconciliation to a GAAP
financial measure, see Statistical Table XV.
Financial Highlights
Net Interest Income
Net interest income on a FTE basis decreased $4.0 billion to $41.6
billion for 2012 compared to 2011. The decline was primarily due
to lower consumer loan balances and yields, the asset and liability
management (ALM) portfolio recouponing to a lower yield and
decreased commercial loan yields. Lower trading-related net
interest income also negatively impacted 2012 results. These
were partially offset by ongoing reductions in long-term debt and
lower rates paid on deposits. The net interest yield on a FTE basis
decreased 13 basis points (bps) to 2.35 percent for 2012
compared to 2011 as the yield continued to be under pressure
due to the aforementioned items and the low rate environment.
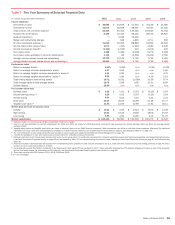
Noninterest Income
Table 3 Noninterest Income
(Dollars in millions) 2012 2011
Card income $ 6,121 $ 7,184
Service charges 7,600 8,094
Investment and brokerage services 11,393 11,826
Investment banking income 5,299 5,217
Equity investment income 2,070 7,360
Trading account profits 5,870 6,697
Mortgage banking income (loss) 4,750 (8,830)
Insurance income (loss) (195) 1,346
Gains on sales of debt securities 1,662 3,374
Other income (loss) (1,839) 6,869
Net impairment losses recognized in earnings on AFS
debt securities (53) (299)
Total noninterest income $ 42,678 $ 48,838