Bank of America 2012 Annual Report Download - page 110
Download and view the complete annual report
Please find page 110 of the 2012 Bank of America annual report below. You can navigate through the pages in the report by either clicking on the pages listed below, or by using the keyword search tool below to find specific information within the annual report.-
 1
1 -
2
-
3
-
4
-
5
-
6
-
7
-
8
-
9
-
10
-
11
-
12
-
13
-
14
-
15
-
16
-
17
-
18
-
19
-
20
-
21
-
22
-
23
-
24
-
25
-
26
-
27
-
28
-
29
-
30
-
31
-
32
-
33
-
34
-
35
-
36
-
37
-
38
-
39
-
40
-
41
-
42
-
43
-
44
-
45
-
46
-
47
-
48
-
49
-
50
-
51
-
52
-
53
-
54
-
55
-
56
-
57
-
58
-
59
-
60
-
61
-
62
-
63
-
64
-
65
-
66
-
67
-
68
-
69
-
70
-
71
-
72
-
73
-
74
-
75
-
76
-
77
-
78
-
79
-
80
-
81
-
82
-
83
-
84
-
85
-
86
-
87
-
88
-
89
-
90
-
91
-
92
-
93
-
94
-
95
-
96
-
97
-
98
-
99
-
 100
100 -
 101
101 -
 102
102 -
 103
103 -
 104
104 -
 105
105 -
 106
106 -
 107
107 -
 108
108 -
 109
109 -
 110
110 -
 111
111 -
 112
112 -
 113
113 -
 114
114 -
 115
115 -
 116
116 -
 117
117 -
 118
118 -
 119
119 -
 120
120 -
121
-
122
-
123
-
124
-
125
-
126
-
127
-
128
-
129
-
130
-
131
-
132
-
133
-
134
-
135
-
136
-
137
-
138
-
139
-
140
-
141
-
142
-
143
-
144
-
145
-
146
-
147
-
148
-
149
-
150
-
151
-
152
-
153
-
154
-
155
-
156
-
157
-
158
-
159
-
160
-
161
-
162
-
163
-
164
-
165
-
166
-
167
-
168
-
169
-
170
-
171
-
172
-
173
-
174
-
175
-
176
-
177
-
178
-
179
-
180
-
181
-
182
-
183
-
184
-
185
-
186
-
187
-
188
-
189
-
190
-
191
-
192
-
193
-
194
-
195
-
196
-
197
-
198
-
199
-
200
-
201
-
202
-
203
-
204
-
205
-
206
-
207
-
208
-
209
-
210
-
211
-
212
-
213
-
214
-
215
-
216
-
217
-
218
-
219
-
220
-
221
-
222
-
223
-
224
-
225
-
226
-
227
-
228
-
229
-
230
-
231
-
232
-
233
-
234
-
235
-
236
-
237
-
238
-
239
-
240
-
241
-
242
-
243
-
244
-
245
-
246
-
247
-
248
-
249
-
250
-
251
-
252
-
253
-
254
-
255
-
256
-
257
-
258
-
259
-
260
-
261
-
262
-
263
-
264
-
265
-
266
-
267
-
268
-
269
-
270
-
271
-
272
-
273
-
274
-
275
-
276
-
277
-
278
-
279
-
280
-
281
-
282
-
283
-
284
 |
 |

108 Bank of America 2012
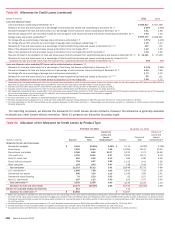
Table 60 Allowance for Credit Losses (continued)
(Dollars in millions) 2012 2011
Loan and allowance ratios:
Loans and leases outstanding at December 31 (5) $ 898,817 $ 917,396
Allowance for loan and lease losses as a percentage of total loans and leases and outstanding at December 31 (5) 2.69%3.68%
Consumer allowance for loan and lease losses as a percentage of total consumer loans outstanding at December 31 (6) 3.81 4.88
Commercial allowance for loan and lease losses as a percentage of total commercial loans and leases outstanding at December 31 (7) 0.90 1.33
Average loans and leases outstanding (5) $ 890,337 $ 929,661
Net charge-offs as a percentage of average loans and leases outstanding (5, 8) 1.67%2.24%
Net charge-offs and PCI write-offs as a percentage of average loans and leases outstanding (5, 9) 1.99 2.24
Allowance for loan and lease losses as a percentage of total nonperforming loans and leases at December 31 (5, 10) 107 135
Ratio of the allowance for loan and lease losses at December 31 to net charge-offs (8) 1.62 1.62
Ratio of the allowance for loan and lease losses at December 31 to net charge-offs and PCI write-offs (9) 1.36 1.62
Amounts included in the allowance for loan and lease losses that are excluded from nonperforming loans and leases at December 31 (11) $12,021 $ 17,490
Allowance for loan and lease losses as a percentage of total nonperforming loans and leases excluding amounts included in the
allowance for loan and lease losses that are excluded from nonperforming loans and leases at December 31 (11) 54%65%
Loan and allowance ratios excluding PCI loans and the related valuation allowance: (12)
Allowance for loan and lease losses as a percentage of total loans and leases outstanding at December 31 (5) 2.14%2.86%
Consumer allowance for loan and lease losses as a percentage of total consumer loans outstanding at December 31 (6) 2.95 3.68
Net charge-offs as a percentage of average loans and leases outstanding (5) 1.73 2.32
Allowance for loan and lease losses as a percentage of total nonperforming loans and leases at December 31 (5, 10) 82 101
Ratio of the allowance for loan and lease losses at December 31 to net charge-offs 1.25 1.22
(5) Outstanding loan and lease balances and ratios do not include loans accounted for under the fair value option. Loans accounted for under the fair value option were $9.0 billion and $8.8 billion at
December 31, 2012 and 2011. Average loans accounted for under the fair value option were $8.4 billion in both 2012 and 2011.
(6) Excludes consumer loans accounted for under the fair value option of $1.0 billion and $2.2 billion at December 31, 2012 and 2011.
(7) Excludes commercial loans accounted for under the fair value option of $8.0 billion and $6.6 billion at December 31, 2012 and 2011.
(8) Net charge-offs exclude $2.8 billion of write-offs in the Countrywide home equity PCI loan portfolio for 2012. These write-offs decreased the PCI valuation allowance included as part of the allowance
for loan and lease losses. For information on PCI write-offs, see Countrywide Purchased Credit-impaired Loan Portfolio on page 86.
(9) There were no write-offs of PCI loans in 2011.
(10) For more information on our definition of nonperforming loans, see pages 89 and 97.
(11) Primarily includes amounts allocated to U.S. credit card and unsecured consumer lending portfolios in CBB, PCI loans and the non-U.S. credit card portfolio in All Other.
(12) For more information on the PCI loan portfolio and the valuation allowance for PCI loans, see Note 5 – Outstanding Loans and Leases and Note 6 – Allowance for Credit Losses to the Consolidated
Financial Statements.
For reporting purposes, we allocate the allowance for credit losses across products. However, the allowance is generally available
to absorb any credit losses without restriction. Table 61 presents our allocation by product type.
Table 61 Allocation of the Allowance for Credit Losses by Product Type
December 31, 2012 December 31, 2011
(Dollars in millions) Amount
Percent of
Total
Percent of
Loans and
Leases
Outstanding (1) Amount
Percent of
Total
Percent of
Loans and
Leases
Outstanding (1)
Allowance for loan and lease losses
Residential mortgage $ 5,004 20.69% 2.06%$ 5,715 16.92% 2.18%
Home equity 7,845 32.45 7.26 13,094 38.76 10.50
Discontinued real estate 2,084 8.62 21.07 2,270 6.72 20.46
U.S. credit card 4,718 19.51 4.97 6,322 18.71 6.18
Non-U.S. credit card 600 2.48 5.13 946 2.80 6.56
Direct/Indirect consumer 718 2.97 0.86 1,153 3.41 1.29
Other consumer 104 0.43 6.40 148 0.44 5.50
Total consumer 21,073 87.15 3.81 29,648 87.76 4.88
U.S. commercial (2) 1,885 7.80 0.90 2,441 7.23 1.26
Commercial real estate 846 3.50 2.19 1,349 3.99 3.41
Commercial lease financing 78 0.32 0.33 92 0.27 0.42
Non-U.S. commercial 297 1.23 0.40 253 0.75 0.46
Total commercial (3) 3,106 12.85 0.90 4,135 12.24 1.33
Allowance for loan and lease losses 24,179 100.00% 2.69 33,783 100.00% 3.68
Reserve for unfunded lending commitments 513 714
Allowance for credit losses (4) $ 24,692 $ 34,497
(1) Ratios are calculated as allowance for loan and lease losses as a percentage of loans and leases outstanding excluding loans accounted for under the fair value option. Consumer loans accounted
for under the fair value option included residential mortgage loans of $147 million and $906 million and discontinued real estate of $858 million and $1.3 billion at December 31, 2012 and 2011.
Commercial loans accounted for under the fair value option included U.S. commercial loans of $2.3 billion and $2.2 billion and non-U.S. commercial loans of $5.7 billion and $4.4 billion at December
31, 2012 and 2011.
(2) Includes allowance for loan and lease losses for U.S. small business commercial loans of $642 million and $893 million at December 31, 2012 and 2011.
(3) Includes allowance for loan and lease losses for impaired commercial loans of $330 million and $545 million at December 31, 2012 and 2011.
(4) Includes $5.5 billion and $8.5 billion of valuation allowance presented with the allowance for credit losses related to PCI loans at December 31, 2012 and 2011.