Bank of America 2012 Annual Report Download - page 91
Download and view the complete annual report
Please find page 91 of the 2012 Bank of America annual report below. You can navigate through the pages in the report by either clicking on the pages listed below, or by using the keyword search tool below to find specific information within the annual report.-
 1
1 -
2
-
3
-
4
-
5
-
6
-
7
-
8
-
9
-
10
-
11
-
12
-
13
-
14
-
15
-
16
-
17
-
18
-
19
-
20
-
21
-
22
-
23
-
24
-
25
-
26
-
27
-
28
-
29
-
30
-
31
-
32
-
33
-
34
-
35
-
36
-
37
-
38
-
39
-
40
-
41
-
42
-
43
-
44
-
45
-
46
-
47
-
48
-
49
-
50
-
51
-
52
-
53
-
54
-
55
-
56
-
57
-
58
-
59
-
60
-
61
-
62
-
63
-
64
-
65
-
66
-
67
-
68
-
69
-
70
-
71
-
72
-
73
-
74
-
75
-
76
-
77
-
78
-
79
-
80
-
 81
81 -
 82
82 -
 83
83 -
 84
84 -
 85
85 -
 86
86 -
 87
87 -
 88
88 -
 89
89 -
 90
90 -
 91
91 -
 92
92 -
 93
93 -
 94
94 -
 95
95 -
 96
96 -
 97
97 -
 98
98 -
 99
99 -
 100
100 -
 101
101 -
102
-
103
-
104
-
105
-
106
-
107
-
108
-
109
-
110
-
111
-
112
-
113
-
114
-
115
-
116
-
117
-
118
-
119
-
120
-
121
-
122
-
123
-
124
-
125
-
126
-
127
-
128
-
129
-
130
-
131
-
132
-
133
-
134
-
135
-
136
-
137
-
138
-
139
-
140
-
141
-
142
-
143
-
144
-
145
-
146
-
147
-
148
-
149
-
150
-
151
-
152
-
153
-
154
-
155
-
156
-
157
-
158
-
159
-
160
-
161
-
162
-
163
-
164
-
165
-
166
-
167
-
168
-
169
-
170
-
171
-
172
-
173
-
174
-
175
-
176
-
177
-
178
-
179
-
180
-
181
-
182
-
183
-
184
-
185
-
186
-
187
-
188
-
189
-
190
-
191
-
192
-
193
-
194
-
195
-
196
-
197
-
198
-
199
-
200
-
201
-
202
-
203
-
204
-
205
-
206
-
207
-
208
-
209
-
210
-
211
-
212
-
213
-
214
-
215
-
216
-
217
-
218
-
219
-
220
-
221
-
222
-
223
-
224
-
225
-
226
-
227
-
228
-
229
-
230
-
231
-
232
-
233
-
234
-
235
-
236
-
237
-
238
-
239
-
240
-
241
-
242
-
243
-
244
-
245
-
246
-
247
-
248
-
249
-
250
-
251
-
252
-
253
-
254
-
255
-
256
-
257
-
258
-
259
-
260
-
261
-
262
-
263
-
264
-
265
-
266
-
267
-
268
-
269
-
270
-
271
-
272
-
273
-
274
-
275
-
276
-
277
-
278
-
279
-
280
-
281
-
282
-
283
-
284
 |
 |
Bank of America 2012 89
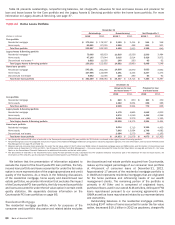
Other Consumer
At December 31, 2012, approximately 87 percent of the $1.6
billion other consumer portfolio was associated with certain
consumer finance businesses that we previously exited and non-
U.S. consumer loan portfolios that are included in All Other. The
remainder is primarily deposit overdrafts included in CBB.
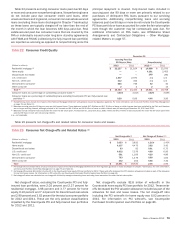
Consumer Loans Accounted for Under the Fair Value
Option
Outstanding consumer loans accounted for under the fair value
option were $1.0 billion at December 31, 2012 and included $858
million of discontinued real estate loans and $147 million of
residential mortgage loans in consolidated variable interest
entities (VIEs). During 2012, we recorded gains of $57 million
resulting from changes in the fair value of the loan portfolio. These
were offset by losses recorded on the related long-term debt.
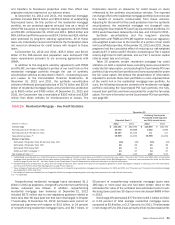
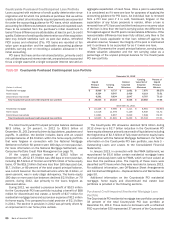
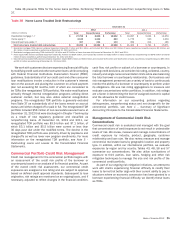
Nonperforming Consumer Loans and Foreclosed
Properties Activity
Table 37 presents nonperforming consumer loans and foreclosed
properties activity during 2012 and 2011. Nonperforming LHFS
are excluded from nonperforming loans as they are recorded at
either fair value or the lower of cost or fair value. Nonperforming
loans do not include past due consumer credit card loans, other
unsecured loans and in general, consumer non-real estate-secured
loans (excluding those loans discharged in Chapter 7 bankruptcy),
as these loans are typically charged off no later than the end of
the month in which the loan becomes 180 days past due. The
fully-insured loan portfolio is not reported as nonperforming as
principal repayment is insured. Additionally, nonperforming loans
do not include the Countrywide PCI loan portfolio or loans
accounted for under the fair value option. For further information
on nonperforming loans, see Note 1 – Summary of Significant
Accounting Principles to the Consolidated Financial Statements.
Nonperforming loans increased $663 million in 2012 to $19.4
billion. During 2012, we reclassified to nonperforming $1.9 billion
of junior-lien loans less than 90 days past due that have a senior-
lien loan that is 90 days or more past due and $1.2 billion of loans
less than 60 days past due that were discharged in Chapter 7
bankruptcy upon implementation of new regulatory guidance.
These additions to nonperforming loans were partially offset by
$435 million of nonperforming loans forgiven in connection with
the National Mortgage Settlement. Excluding the impact of these
items, nonperforming loans declined in 2012 as outflows outpaced
new inflows which continued to improve due to favorable
delinquency trends. For more information on the impacts related
to the National Mortgage Settlement and guidance issued by
regulatory agencies, see Consumer Portfolio Credit Risk
Management on page 76 and Table 21.
The outstanding balance of a real estate-secured loan that is
in excess of the estimated property value, after reducing the
estimated property value for estimated costs to sell, is charged
off no later than the end of the month in which the loan becomes
180 days past due unless repayment of the loan is fully insured.
At December 31, 2012, $10.7 billion, or 54 percent, of
nonperforming consumer real estate loans and foreclosed
properties had been written down to their estimated property value
less estimated costs to sell, including $10.1 billion of
nonperforming loans 180 days or more past due and $650 million
of foreclosed properties.
Foreclosed properties decreased $1.3 billion in 2012 as
liquidations outpaced additions. PCI loans are excluded from
nonperforming loans as these loans were written down to fair value
at the acquisition date; however, once the underlying real estate
is acquired by the Corporation upon foreclosure of the delinquent
PCI loan, it is included in foreclosed properties. Countrywide PCI
related foreclosed properties decreased $322 million in 2012.
Not included in foreclosed properties at December 31, 2012 was
$2.5 billion of real estate that was acquired upon foreclosure of
delinquent FHA-insured loans. We hold this real estate on our
balance sheet until we convey these properties to the FHA. We
exclude these amounts from our nonperforming loans and
foreclosed properties activity as we will be reimbursed once the
property is conveyed to the FHA for principal and, up to certain
limits, costs incurred during the foreclosure process and interest
incurred during the holding period. For additional information on
the review of our foreclosure processes, see Off-Balance Sheet
Arrangements and Contractual Obligations – Other Mortgage-
related Matters on page 57.