Bank of America 2012 Annual Report Download - page 42
Download and view the complete annual report
Please find page 42 of the 2012 Bank of America annual report below. You can navigate through the pages in the report by either clicking on the pages listed below, or by using the keyword search tool below to find specific information within the annual report.-
 1
1 -
2
-
3
-
4
-
5
-
6
-
7
-
8
-
9
-
10
-
11
-
12
-
13
-
14
-
15
-
16
-
17
-
18
-
19
-
20
-
21
-
22
-
23
-
24
-
25
-
26
-
27
-
28
-
29
-
30
-
31
-
 32
32 -
 33
33 -
 34
34 -
 35
35 -
 36
36 -
 37
37 -
 38
38 -
 39
39 -
 40
40 -
 41
41 -
 42
42 -
 43
43 -
 44
44 -
 45
45 -
 46
46 -
 47
47 -
 48
48 -
 49
49 -
 50
50 -
 51
51 -
 52
52 -
53
-
54
-
55
-
56
-
57
-
58
-
59
-
60
-
61
-
62
-
63
-
64
-
65
-
66
-
67
-
68
-
69
-
70
-
71
-
72
-
73
-
74
-
75
-
76
-
77
-
78
-
79
-
80
-
81
-
82
-
83
-
84
-
85
-
86
-
87
-
88
-
89
-
90
-
91
-
92
-
93
-
94
-
95
-
96
-
97
-
98
-
99
-
100
-
101
-
102
-
103
-
104
-
105
-
106
-
107
-
108
-
109
-
110
-
111
-
112
-
113
-
114
-
115
-
116
-
117
-
118
-
119
-
120
-
121
-
122
-
123
-
124
-
125
-
126
-
127
-
128
-
129
-
130
-
131
-
132
-
133
-
134
-
135
-
136
-
137
-
138
-
139
-
140
-
141
-
142
-
143
-
144
-
145
-
146
-
147
-
148
-
149
-
150
-
151
-
152
-
153
-
154
-
155
-
156
-
157
-
158
-
159
-
160
-
161
-
162
-
163
-
164
-
165
-
166
-
167
-
168
-
169
-
170
-
171
-
172
-
173
-
174
-
175
-
176
-
177
-
178
-
179
-
180
-
181
-
182
-
183
-
184
-
185
-
186
-
187
-
188
-
189
-
190
-
191
-
192
-
193
-
194
-
195
-
196
-
197
-
198
-
199
-
200
-
201
-
202
-
203
-
204
-
205
-
206
-
207
-
208
-
209
-
210
-
211
-
212
-
213
-
214
-
215
-
216
-
217
-
218
-
219
-
220
-
221
-
222
-
223
-
224
-
225
-
226
-
227
-
228
-
229
-
230
-
231
-
232
-
233
-
234
-
235
-
236
-
237
-
238
-
239
-
240
-
241
-
242
-
243
-
244
-
245
-
246
-
247
-
248
-
249
-
250
-
251
-
252
-
253
-
254
-
255
-
256
-
257
-
258
-
259
-
260
-
261
-
262
-
263
-
264
-
265
-
266
-
267
-
268
-
269
-
270
-
271
-
272
-
273
-
274
-
275
-
276
-
277
-
278
-
279
-
280
-
281
-
282
-
283
-
284
 |
 |

40 Bank of America 2012
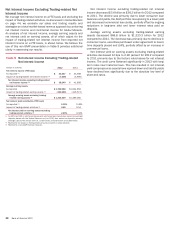
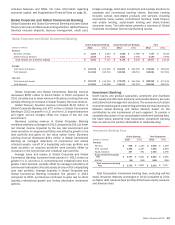
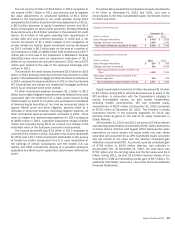
The table below summarizes the components of mortgage
banking income (loss).
Mortgage Banking Income (Loss)
(Dollars in millions) 2012 2011
Production income (loss):
Core production revenue $ 3,730 $ 2,797
Representations and warranties provision (3,939) (15,591)
Total production loss (209) (12,794)
Servicing income:
Servicing fees 4,734 6,035
Impact of customer payments (1) (1,484) (2,621)
Fair value changes of MSRs, net of risk management
activities used to hedge certain market risks (2) 1,845 655
Other servicing-related revenue 645 532
Total net servicing income 5,740 4,601
Total CRES mortgage banking income (loss) 5,531 (8,193)
Eliminations (3) (781) (637)
Total consolidated mortgage banking income (loss) $ 4,750 $ (8,830)
(1) Represents the change in the market value of the MSR asset due to the impact of customer
payments received during the year.
(2) Includes gains (losses) on sales of MSRs.
(3) Includes the effect of transfers of mortgage loans from CRES to the ALM portfolio in All Other.
CRES first mortgage loan originations declined $80.8 billion,
or 58 percent, primarily as a result of our exit from the
correspondent lending channel in 2011. CRES retail first mortgage
loan originations were $58.5 billion in 2012 compared to $67.8
billion in 2011, excluding correspondent lending, reflecting a drop
in estimated retail market share as the overall market for
mortgages increased. Our decline in market share was primarily
due to our decision to price loan products in order to manage our
fulfillment capacity. Core production revenue increased $933
million to $3.7 billion as the impact of our exit from the
correspondent lending channel and the decline in retail
originations were more than offset by higher retail margins. On an
industry-wide basis margins increased as historically low mortgage
rates drove strong consumer demand for refinance transactions
at a time when most lenders had capacity constraints which,
combined with our pricing strategy, contributed to higher retail
margins. In addition, a higher proportion of refinance transactions,
particularly Home Affordable Refinance Programs (HARP),
contributed to higher margins. During 2012, 84 percent of our first
mortgage production volume was for refinance originations and
16 percent was for purchase originations compared to 60 percent
and 40 percent in 2011.
The representations and warranties provision decreased $11.7
billion to $3.9 billion as described earlier in this section.
Net servicing income increased $1.1 billion to $5.7 billion
primarily due to $1.2 billion in improved MSR results, net of
hedges, and $1.1 billion in reduced impact of customer payments
driven by a lower MSR asset, partially offset by a $1.3 billion
decrease in servicing fees primarily due to a reduction in the size
of the servicing portfolio. For additional information, see Note 24
– Mortgage Servicing Rights to the Consolidated Financial
Statements.
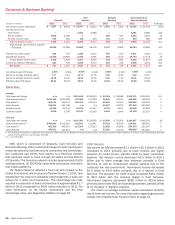
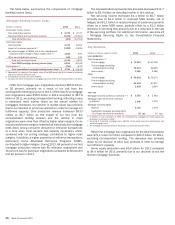
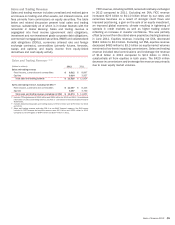
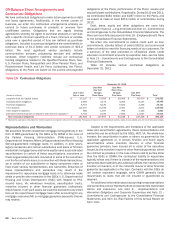
Key Statistics
(Dollars in millions, except as noted) 2012 2011
Loan production
Total Corporation (1):
First mortgage $ 75,074 $ 151,756
First mortgage (excluding
correspondent lending) 75,074 80,300
Home equity 3,585 4,388
CRES:
First mortgage $ 58,518 $ 139,273
First mortgage (excluding
correspondent lending) 58,518 67,817
Home equity 2,832 3,694
Year end
Mortgage serviced portfolio (in billions) (2, 3) $ 1,332 $ 1,763
Mortgage loans serviced for investors
(in billions) 1,045 1,379
Mortgage servicing rights:
Balance 5,716 7,378
Capitalized mortgage servicing rights
(% of loans serviced for investors) 55 bps 54 bps
(1) In addition to loan production in CRES, the remaining first mortgage and home equity loan
production is primarily in GWIM.
(2) Servicing of residential mortgage loans, HELOCs, home equity loans and discontinued real
estate mortgage loans.
(3) The mortgage serviced portfolio at December 31, 2010 was $2,057 billion.
Retail first mortgage loan originations for the total Corporation
were $75.1 billion for 2012 compared to $80.3 billion for 2011,
excluding correspondent lending. The decrease was primarily
driven by our decision to price loan products in order to manage
our fulfillment capacity.
Home equity production was $3.6 billion for 2012 compared
to $4.4 billion for 2011 primarily due to our decision to exit the
reverse mortgage business.