Bank of America 2012 Annual Report Download - page 94
Download and view the complete annual report
Please find page 94 of the 2012 Bank of America annual report below. You can navigate through the pages in the report by either clicking on the pages listed below, or by using the keyword search tool below to find specific information within the annual report.-
 1
1 -
2
-
3
-
4
-
5
-
6
-
7
-
8
-
9
-
10
-
11
-
12
-
13
-
14
-
15
-
16
-
17
-
18
-
19
-
20
-
21
-
22
-
23
-
24
-
25
-
26
-
27
-
28
-
29
-
30
-
31
-
32
-
33
-
34
-
35
-
36
-
37
-
38
-
39
-
40
-
41
-
42
-
43
-
44
-
45
-
46
-
47
-
48
-
49
-
50
-
51
-
52
-
53
-
54
-
55
-
56
-
57
-
58
-
59
-
60
-
61
-
62
-
63
-
64
-
65
-
66
-
67
-
68
-
69
-
70
-
71
-
72
-
73
-
74
-
75
-
76
-
77
-
78
-
79
-
80
-
81
-
82
-
83
-
 84
84 -
 85
85 -
 86
86 -
 87
87 -
 88
88 -
 89
89 -
 90
90 -
 91
91 -
 92
92 -
 93
93 -
 94
94 -
 95
95 -
 96
96 -
 97
97 -
 98
98 -
 99
99 -
 100
100 -
 101
101 -
 102
102 -
 103
103 -
 104
104 -
105
-
106
-
107
-
108
-
109
-
110
-
111
-
112
-
113
-
114
-
115
-
116
-
117
-
118
-
119
-
120
-
121
-
122
-
123
-
124
-
125
-
126
-
127
-
128
-
129
-
130
-
131
-
132
-
133
-
134
-
135
-
136
-
137
-
138
-
139
-
140
-
141
-
142
-
143
-
144
-
145
-
146
-
147
-
148
-
149
-
150
-
151
-
152
-
153
-
154
-
155
-
156
-
157
-
158
-
159
-
160
-
161
-
162
-
163
-
164
-
165
-
166
-
167
-
168
-
169
-
170
-
171
-
172
-
173
-
174
-
175
-
176
-
177
-
178
-
179
-
180
-
181
-
182
-
183
-
184
-
185
-
186
-
187
-
188
-
189
-
190
-
191
-
192
-
193
-
194
-
195
-
196
-
197
-
198
-
199
-
200
-
201
-
202
-
203
-
204
-
205
-
206
-
207
-
208
-
209
-
210
-
211
-
212
-
213
-
214
-
215
-
216
-
217
-
218
-
219
-
220
-
221
-
222
-
223
-
224
-
225
-
226
-
227
-
228
-
229
-
230
-
231
-
232
-
233
-
234
-
235
-
236
-
237
-
238
-
239
-
240
-
241
-
242
-
243
-
244
-
245
-
246
-
247
-
248
-
249
-
250
-
251
-
252
-
253
-
254
-
255
-
256
-
257
-
258
-
259
-
260
-
261
-
262
-
263
-
264
-
265
-
266
-
267
-
268
-
269
-
270
-
271
-
272
-
273
-
274
-
275
-
276
-
277
-
278
-
279
-
280
-
281
-
282
-
283
-
284
 |
 |

92 Bank of America 2012
We account for certain large corporate loans and loan
commitments, including issued but unfunded letters of credit
which are considered utilized for credit risk management purposes,
that exceed our single name credit risk concentration guidelines
under the fair value option. Lending commitments, both funded
and unfunded, are actively managed and monitored, and as
appropriate, credit risk for these lending relationships may be
mitigated through the use of credit derivatives, with the
Corporation’s credit view and market perspectives determining the
size and timing of the hedging activity. In addition, we purchase
credit protection to cover the funded portion as well as the
unfunded portion of certain other credit exposures. To lessen the
cost of obtaining our desired credit protection levels, credit
exposure may be added within an industry, borrower or
counterparty group by selling protection. These credit derivatives
do not meet the requirements for treatment as accounting hedges.
They are carried at fair value with changes in fair value recorded
in other income (loss).
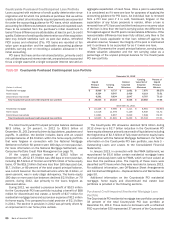
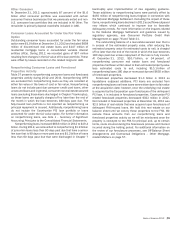
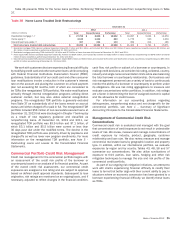
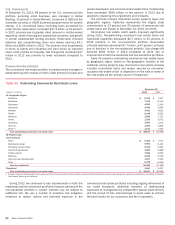
Commercial Credit Portfolio
Table 39 presents our commercial loans and leases, and related
credit quality information at December 31, 2012 and 2011.
Table 39 Commercial Loans and Leases
December 31
Outstandings Nonperforming
Accruing Past Due
90 Days or More
(Dollars in millions) 2012 2011 2012 2011 2012 2011
U.S. commercial $ 197,126 $179,948 $ 1,484 $ 2,174 $65 $ 75
Commercial real estate (1) 38,637 39,596 1,513 3,880 29 7
Commercial lease financing 23,843 21,989 44 26 15 14
Non-U.S. commercial 74,184 55,418 68 143 ——
333,790 296,951 3,109 6,223 109 96
U.S. small business commercial (2) 12,593 13,251 115 114 120 216
Commercial loans excluding loans accounted for under the fair value option 346,383 310,202 3,224 6,337 229 312
Loans accounted for under the fair value option (3) 7,997 6,614 11 73 ——
Total commercial loans and leases $ 354,380 $316,816 $ 3,235 $ 6,410 $229 $ 312
(1) Includes U.S. commercial real estate loans of $37.2 billion and $37.8 billion and non-U.S. commercial real estate loans of $1.5 billion and $1.8 billion at December 31, 2012 and 2011.
(2) Includes card-related products.
(3) Commercial loans accounted for under the fair value option include U.S. commercial loans of $2.3 billion and $2.2 billion, and non-U.S. commercial loans of $5.7 billion and $4.4 billion at December
31, 2012 and 2011. See Note 22 – Fair Value Option to the Consolidated Financial Statements for additional information on the fair value option.
Outstanding commercial loans and leases increased $37.6
billion in 2012, primarily in non-U.S. commercial and U.S.
commercial. During 2012, credit quality in the commercial loan
portfolio continued to show improvement relative to the prior year.
Reservable criticized balances and nonperforming loans, leases
and foreclosed property balances in the commercial credit portfolio
declined during 2012 and the declines were primarily in the
commercial real estate and U.S. commercial portfolios.
Commercial real estate continued to show improvement in both
the residential and non-residential portfolios. The reduction in
reservable criticized U.S. commercial loans was driven by broad-
based improvements in terms of clients, industries and
businesses. Most other credit indicators across the remaining
commercial portfolios also improved in 2012. The allowance for
loan and lease losses declined $1.0 billion from December 31,
2011 to $3.1 billion at December 31, 2012 due to improvements
in the core commercial portfolio (total commercial products
excluding U.S. small business). For more information, see
Allowance for Credit Losses on page 105.
Nonperforming commercial loans and leases as a percentage
of outstanding commercial loans and leases was 0.91 percent
and 2.02 percent (0.93 percent and 2.04 percent excluding loans
accounted for under the fair value option) at December 31, 2012
and 2011. Accruing commercial loans and leases past due 90
days or more as a percentage of outstanding commercial loans
and leases was 0.06 percent and 0.10 percent at December 31,
2012 and 2011.
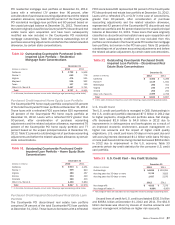
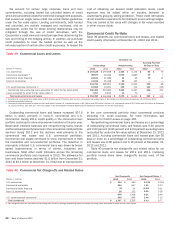
Table 40 presents net charge-offs and related ratios for our
commercial loans and leases for 2012 and 2011. Improving
portfolio trends drove lower charge-offs across most of the
portfolio.
Table 40 Commercial Net Charge-offs and Related Ratios
Net Charge-offs Net Charge-off Ratios (1)
(Dollars in millions) 2012 2011 2012 2011
U.S. commercial $242 $ 195 0.13%0.11%
Commercial real estate 384 947 1.01 2.13
Commercial lease financing (6) 24 (0.03) 0.11
Non-U.S. commercial 28 152 0.05 0.36
648 1,318 0.21 0.46
U.S. small business commercial 699 995 5.46 7.12
Total commercial $ 1,347 $ 2,313 0.43 0.77
(1) Net charge-off ratios are calculated as net charge-offs divided by average outstanding loans and leases excluding loans accounted for under the fair value option.