Bank of America 2012 Annual Report Download - page 270
Download and view the complete annual report
Please find page 270 of the 2012 Bank of America annual report below. You can navigate through the pages in the report by either clicking on the pages listed below, or by using the keyword search tool below to find specific information within the annual report.-
 1
1 -
2
-
3
-
4
-
5
-
6
-
7
-
8
-
9
-
10
-
11
-
12
-
13
-
14
-
15
-
16
-
17
-
18
-
19
-
20
-
21
-
22
-
23
-
24
-
25
-
26
-
27
-
28
-
29
-
30
-
31
-
32
-
33
-
34
-
35
-
36
-
37
-
38
-
39
-
40
-
41
-
42
-
43
-
44
-
45
-
46
-
47
-
48
-
49
-
50
-
51
-
52
-
53
-
54
-
55
-
56
-
57
-
58
-
59
-
60
-
61
-
62
-
63
-
64
-
65
-
66
-
67
-
68
-
69
-
70
-
71
-
72
-
73
-
74
-
75
-
76
-
77
-
78
-
79
-
80
-
81
-
82
-
83
-
84
-
85
-
86
-
87
-
88
-
89
-
90
-
91
-
92
-
93
-
94
-
95
-
96
-
97
-
98
-
99
-
100
-
101
-
102
-
103
-
104
-
105
-
106
-
107
-
108
-
109
-
110
-
111
-
112
-
113
-
114
-
115
-
116
-
117
-
118
-
119
-
120
-
121
-
122
-
123
-
124
-
125
-
126
-
127
-
128
-
129
-
130
-
131
-
132
-
133
-
134
-
135
-
136
-
137
-
138
-
139
-
140
-
141
-
142
-
143
-
144
-
145
-
146
-
147
-
148
-
149
-
150
-
151
-
152
-
153
-
154
-
155
-
156
-
157
-
158
-
159
-
160
-
161
-
162
-
163
-
164
-
165
-
166
-
167
-
168
-
169
-
170
-
171
-
172
-
173
-
174
-
175
-
176
-
177
-
178
-
179
-
180
-
181
-
182
-
183
-
184
-
185
-
186
-
187
-
188
-
189
-
190
-
191
-
192
-
193
-
194
-
195
-
196
-
197
-
198
-
199
-
200
-
201
-
202
-
203
-
204
-
205
-
206
-
207
-
208
-
209
-
210
-
211
-
212
-
213
-
214
-
215
-
216
-
217
-
218
-
219
-
220
-
221
-
222
-
223
-
224
-
225
-
226
-
227
-
228
-
229
-
230
-
231
-
232
-
233
-
234
-
235
-
236
-
237
-
238
-
239
-
240
-
241
-
242
-
243
-
244
-
245
-
246
-
247
-
248
-
249
-
250
-
251
-
252
-
253
-
254
-
255
-
256
-
257
-
258
-
259
-
 260
260 -
 261
261 -
 262
262 -
 263
263 -
 264
264 -
 265
265 -
 266
266 -
 267
267 -
 268
268 -
 269
269 -
 270
270 -
 271
271 -
 272
272 -
 273
273 -
 274
274 -
 275
275 -
 276
276 -
 277
277 -
 278
278 -
 279
279 -
 280
280 -
281
-
282
-
283
-
284
 |
 |

268 Bank of America 2012
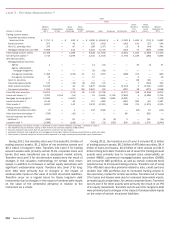
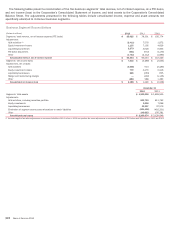
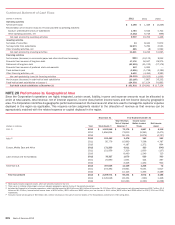
The table below provides information about where changes in the fair value of assets and liabilities accounted for under the fair
value option are included in the Corporation’s Consolidated Statement of Income for 2012, 2011 and 2010.
Gains (Losses) Relating to Assets and Liabilities Accounted for Under the Fair Value Option
2012
(Dollars in millions)
Trading
Account
Profits
(Losses)
Mortgage
Banking
Income
(Loss)
Other
Income
(Loss) Total
Loans reported as trading account assets $232 $ —$ —$ 232
Consumer and commercial loans 17 — 542 559
Loans held-for-sale 75 2,116 190 2,381
Securities financing agreements (90) — —(90)
Other assets ——
12 12
Long-term deposits ——
29 29
Asset-backed secured financings — (180) —(180)
Unfunded loan commitments ——
704 704
Other short-term borrowings 1——1
Long-term debt (1) (1,888)—
(5,107) (6,995)
Total $ (1,653) $ 1,936 $ (3,630) $ (3,347)
2011
Loans reported as trading account assets $ 73 $ — $ — $ 73
Consumer and commercial loans 15 — (275) (260)
Loans held-for-sale (20) 4,137 148 4,265
Securities financing agreements 127 — — 127
Other assets — — 196 196
Long-term deposits — — (77) (77)
Asset-backed secured financings — (30) — (30)
Unfunded loan commitments — — (429) (429)
Other short-term borrowings 261 — — 261
Long-term debt (1) 2,149 — 3,320 5,469
Total $ 2,605 $ 4,107 $ 2,883 $ 9,595
2010
Loans reported as trading account assets $ 157 $ — $ — $ 157
Commercial loans 2 — 82 84
Loans held-for-sale — 9,091 493 9,584
Securities financing agreements 52 — — 52
Other assets — — 107 107
Long-term deposits — — (48) (48)
Asset-backed secured financings — (95) — (95)
Unfunded loan commitments — — 23 23
Other short-term borrowings (192) — — (192)
Long-term debt (1) (621) — 18 (603)
Total $ (602) $ 8,996 $ 675 $ 9,069
(1) The majority of the net gains (losses) in trading account profits (losses) relate to the embedded derivative in structured liabilities and are offset by gains (losses) on derivatives and securities that
hedge these liabilities. The net gains (losses) in other income (loss) relate to the impact on structured liabilities of changes in the Corporation’s credit spread.
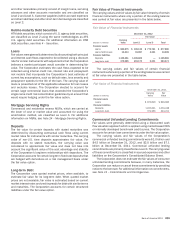
NOTE 23 Fair Value of Financial Instruments
The fair values of financial instruments and their classifications
within the fair value hierarchy have been derived using
methodologies described in Note 21 – Fair Value Measurements.
The following disclosures include financial instruments where only
a portion of the ending balance at December 31, 2012 and 2011
was carried at fair value on the Corporation’s Consolidated Balance
Sheet.
Short-term Financial Instruments
The carrying value of short-term financial instruments, including
cash and cash equivalents, time deposits placed and other short-
term investments, federal funds sold and purchased, resale and
certain repurchase agreements, customer and other receivables,
customer payables (within accrued expenses and other liabilities
on the Corporation’s Consolidated Balance Sheet), and other short-
term borrowings approximates the fair value of these instruments.
These financial instruments generally expose the Corporation to
limited credit risk and have no stated maturities or have short-
term maturities and carry interest rates that approximate market.
The Corporation elected to account for certain repurchase
agreements under the fair value option.
Under the fair value hierarchy, cash and cash equivalents are
classified as Level 1. Time deposits placed and other short-term
investments, such as U.S. government securities and short-term
commercial paper, are classified as Level 1 and Level 2. Federal
funds sold and purchased are classified as Level 2. Resale and
repurchase agreements are classified as Level 2 because they
are generally short-dated and/or variable-rate instruments
collateralized by U.S. government or agency securities. Customer