Bank of America 2012 Annual Report Download - page 141
Download and view the complete annual report
Please find page 141 of the 2012 Bank of America annual report below. You can navigate through the pages in the report by either clicking on the pages listed below, or by using the keyword search tool below to find specific information within the annual report.-
 1
1 -
2
-
3
-
4
-
5
-
6
-
7
-
8
-
9
-
10
-
11
-
12
-
13
-
14
-
15
-
16
-
17
-
18
-
19
-
20
-
21
-
22
-
23
-
24
-
25
-
26
-
27
-
28
-
29
-
30
-
31
-
32
-
33
-
34
-
35
-
36
-
37
-
38
-
39
-
40
-
41
-
42
-
43
-
44
-
45
-
46
-
47
-
48
-
49
-
50
-
51
-
52
-
53
-
54
-
55
-
56
-
57
-
58
-
59
-
60
-
61
-
62
-
63
-
64
-
65
-
66
-
67
-
68
-
69
-
70
-
71
-
72
-
73
-
74
-
75
-
76
-
77
-
78
-
79
-
80
-
81
-
82
-
83
-
84
-
85
-
86
-
87
-
88
-
89
-
90
-
91
-
92
-
93
-
94
-
95
-
96
-
97
-
98
-
99
-
100
-
101
-
102
-
103
-
104
-
105
-
106
-
107
-
108
-
109
-
110
-
111
-
112
-
113
-
114
-
115
-
116
-
117
-
118
-
119
-
120
-
121
-
122
-
123
-
124
-
125
-
126
-
127
-
128
-
129
-
130
-
 131
131 -
 132
132 -
 133
133 -
 134
134 -
 135
135 -
 136
136 -
 137
137 -
 138
138 -
 139
139 -
 140
140 -
 141
141 -
 142
142 -
 143
143 -
 144
144 -
 145
145 -
 146
146 -
 147
147 -
 148
148 -
 149
149 -
 150
150 -
 151
151 -
152
-
153
-
154
-
155
-
156
-
157
-
158
-
159
-
160
-
161
-
162
-
163
-
164
-
165
-
166
-
167
-
168
-
169
-
170
-
171
-
172
-
173
-
174
-
175
-
176
-
177
-
178
-
179
-
180
-
181
-
182
-
183
-
184
-
185
-
186
-
187
-
188
-
189
-
190
-
191
-
192
-
193
-
194
-
195
-
196
-
197
-
198
-
199
-
200
-
201
-
202
-
203
-
204
-
205
-
206
-
207
-
208
-
209
-
210
-
211
-
212
-
213
-
214
-
215
-
216
-
217
-
218
-
219
-
220
-
221
-
222
-
223
-
224
-
225
-
226
-
227
-
228
-
229
-
230
-
231
-
232
-
233
-
234
-
235
-
236
-
237
-
238
-
239
-
240
-
241
-
242
-
243
-
244
-
245
-
246
-
247
-
248
-
249
-
250
-
251
-
252
-
253
-
254
-
255
-
256
-
257
-
258
-
259
-
260
-
261
-
262
-
263
-
264
-
265
-
266
-
267
-
268
-
269
-
270
-
271
-
272
-
273
-
274
-
275
-
276
-
277
-
278
-
279
-
280
-
281
-
282
-
283
-
284
 |
 |

Bank of America 2012 139
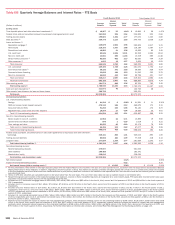
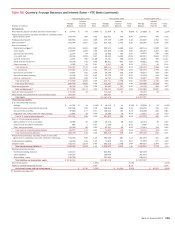
Table XIII Quarterly Average Balances and Interest Rates – FTE Basis (continued)
Second Quarter 2012 First Quarter 2012 Fourth Quarter 2011
(Dollars in millions)
Average
Balance
Interest
Income/
Expense
Yield/
Rate
Average
Balance
Interest
Income/
Expense
Yield/
Rate
Average
Balance
Interest
Income/
Expense
Yield/
Rate
Earning assets
Time deposits placed and other short-term investments (1) $ 27,476 $ 64 0.94% $ 31,404 $ 65 0.83% $ 27,688 $ 85 1.19%
Federal funds sold and securities borrowed or purchased under
agreements to resell 234,148 360 0.62 233,061 460 0.79 237,453 449 0.75
Trading account assets 180,694 1,302 2.89 175,778 1,399 3.19 161,848 1,354 3.33
Debt securities (2) 342,244 1,907 2.23 327,758 2,732 3.33 332,990 2,245 2.69
Loans and leases (3):
Residential mortgage (4) 255,349 2,462 3.86 260,573 2,489 3.82 266,144 2,596 3.90
Home equity 119,657 1,090 3.66 122,933 1,164 3.80 126,251 1,207 3.80
Discontinued real estate 11,144 94 3.36 12,082 103 3.42 14,073 128 3.65
U.S. credit card 95,018 2,356 9.97 98,334 2,459 10.06 102,241 2,603 10.10
Non-U.S. credit card 13,641 396 11.68 14,151 408 11.60 15,981 420 10.41
Direct/Indirect consumer (5) 84,198 733 3.50 88,321 801 3.65 90,861 863 3.77
Other consumer (6) 2,565 41 6.41 2,617 40 6.24 2,751 41 6.14
Total consumer 581,572 7,172 4.95 599,011 7,464 5.00 618,302 7,858 5.06
U.S. commercial 199,644 1,742 3.51 195,111 1,756 3.62 196,778 1,798 3.63
Commercial real estate (7) 37,627 323 3.46 39,190 339 3.48 40,673 343 3.34
Commercial lease financing 21,446 216 4.02 21,679 272 5.01 21,278 204 3.84
Non-U.S. commercial 59,209 369 2.50 58,731 391 2.68 55,867 395 2.80
Total commercial 317,926 2,650 3.35 314,711 2,758 3.52 314,596 2,740 3.46
Total loans and leases 899,498 9,822 4.38 913,722 10,222 4.49 932,898 10,598 4.52
Other earning assets 88,508 719 3.26 86,382 743 3.46 91,109 904 3.95
Total earning assets (8) 1,772,568 14,174 3.21 1,768,105 15,621 3.55 1,783,986 15,635 3.49
Cash and cash equivalents (1) 116,025 52 112,512 47 94,287 36
Other assets, less allowance for loan and lease losses 305,970 306,557 329,294
Total assets $ 2,194,563 $ 2,187,174 $ 2,207,567
Interest-bearing liabilities
U.S. interest-bearing deposits:
Savings $ 42,394 $ 14 0.13% $ 40,543 $ 14 0.14% $ 39,609 $ 16 0.16%
NOW and money market deposit accounts 460,788 188 0.16 458,649 186 0.16 454,249 192 0.17
Consumer CDs and IRAs 96,858 171 0.71 100,044 194 0.78 103,488 220 0.84
Negotiable CDs, public funds and other deposits 21,661 35 0.65 22,586 36 0.64 22,413 34 0.60
Total U.S. interest-bearing deposits 621,701 408 0.26 621,822 430 0.28 619,759 462 0.30
Non-U.S. interest-bearing deposits:
Banks located in non-U.S. countries 14,598 25 0.69 18,170 28 0.62 20,454 29 0.55
Governments and official institutions 895 1 0.37 1,286 1 0.41 1,466 1 0.36
Time, savings and other 52,584 85 0.65 55,241 90 0.66 57,814 124 0.85
Total non-U.S. interest-bearing deposits 68,077 111 0.65 74,697 119 0.64 79,734 154 0.77
Total interest-bearing deposits 689,778 519 0.30 696,519 549 0.32 699,493 616 0.35
Federal funds purchased, securities loaned or sold under
agreements to repurchase and other short-term borrowings 318,909 943 1.19 293,056 881 1.21 284,766 921 1.28
Trading account liabilities 84,728 448 2.13 71,872 477 2.67 70,999 411 2.29
Long-term debt 333,173 2,534 3.05 363,518 2,708 2.99 389,557 2,764 2.80
Total interest-bearing liabilities (8) 1,426,588 4,444 1.25 1,424,965 4,615 1.30 1,444,815 4,712 1.29
Noninterest-bearing sources:
Noninterest-bearing deposits 343,110 333,593 333,038
Other liabilities 189,307 196,050 201,479
Shareholders’ equity 235,558 232,566 228,235
Total liabilities and shareholders’ equity $ 2,194,563 $ 2,187,174 $ 2,207,567
Net interest spread 1.96% 2.25% 2.20%
Impact of noninterest-bearing sources 0.24 0.25 0.24
Net interest income/yield on earning assets (1) $ 9,730 2.20% $ 11,006 2.50% $ 10,923 2.44%
For footnotes see page 138.