Bank of America 2012 Annual Report Download - page 36
Download and view the complete annual report
Please find page 36 of the 2012 Bank of America annual report below. You can navigate through the pages in the report by either clicking on the pages listed below, or by using the keyword search tool below to find specific information within the annual report.-
 1
1 -
2
-
3
-
4
-
5
-
6
-
7
-
8
-
9
-
10
-
11
-
12
-
13
-
14
-
15
-
16
-
17
-
18
-
19
-
20
-
21
-
22
-
23
-
24
-
25
-
 26
26 -
 27
27 -
 28
28 -
 29
29 -
 30
30 -
 31
31 -
 32
32 -
 33
33 -
 34
34 -
 35
35 -
 36
36 -
 37
37 -
 38
38 -
 39
39 -
 40
40 -
 41
41 -
 42
42 -
 43
43 -
 44
44 -
 45
45 -
 46
46 -
47
-
48
-
49
-
50
-
51
-
52
-
53
-
54
-
55
-
56
-
57
-
58
-
59
-
60
-
61
-
62
-
63
-
64
-
65
-
66
-
67
-
68
-
69
-
70
-
71
-
72
-
73
-
74
-
75
-
76
-
77
-
78
-
79
-
80
-
81
-
82
-
83
-
84
-
85
-
86
-
87
-
88
-
89
-
90
-
91
-
92
-
93
-
94
-
95
-
96
-
97
-
98
-
99
-
100
-
101
-
102
-
103
-
104
-
105
-
106
-
107
-
108
-
109
-
110
-
111
-
112
-
113
-
114
-
115
-
116
-
117
-
118
-
119
-
120
-
121
-
122
-
123
-
124
-
125
-
126
-
127
-
128
-
129
-
130
-
131
-
132
-
133
-
134
-
135
-
136
-
137
-
138
-
139
-
140
-
141
-
142
-
143
-
144
-
145
-
146
-
147
-
148
-
149
-
150
-
151
-
152
-
153
-
154
-
155
-
156
-
157
-
158
-
159
-
160
-
161
-
162
-
163
-
164
-
165
-
166
-
167
-
168
-
169
-
170
-
171
-
172
-
173
-
174
-
175
-
176
-
177
-
178
-
179
-
180
-
181
-
182
-
183
-
184
-
185
-
186
-
187
-
188
-
189
-
190
-
191
-
192
-
193
-
194
-
195
-
196
-
197
-
198
-
199
-
200
-
201
-
202
-
203
-
204
-
205
-
206
-
207
-
208
-
209
-
210
-
211
-
212
-
213
-
214
-
215
-
216
-
217
-
218
-
219
-
220
-
221
-
222
-
223
-
224
-
225
-
226
-
227
-
228
-
229
-
230
-
231
-
232
-
233
-
234
-
235
-
236
-
237
-
238
-
239
-
240
-
241
-
242
-
243
-
244
-
245
-
246
-
247
-
248
-
249
-
250
-
251
-
252
-
253
-
254
-
255
-
256
-
257
-
258
-
259
-
260
-
261
-
262
-
263
-
264
-
265
-
266
-
267
-
268
-
269
-
270
-
271
-
272
-
273
-
274
-
275
-
276
-
277
-
278
-
279
-
280
-
281
-
282
-
283
-
284
 |
 |

34 Bank of America 2012
Consumer & Business Banking
Deposits
Card
Services
Business
Banking
Total Consumer &
Business Banking
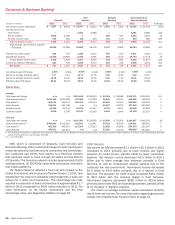
(Dollars in millions) 2012 2011 2012 2011 2012 2011 2012 2011 % Change
Net interest income (FTE basis) $ 7,857 $ 8,472 $ 10,047 $ 11,502 $ 1,221 $ 1,404 $19,125 $ 21,378 (11)%
Noninterest income:
Card income ——5,261 6,286 ——5,261 6,286 (16)
Service charges 3,922 4,000 1—361 524 4,284 4,524 (5)
All other income (loss) 276 224 (54) 328 131 140 353 692 (49)
Total noninterest income 4,198 4,224 5,208 6,614 492 664 9,898 11,502 (14)
Total revenue, net of interest expense
(FTE basis) 12,055 12,696 15,255 18,116 1,713 2,068 29,023 32,880 (12)
Provision for credit losses 208 173 3,452 3,072 281 245 3,941 3,490 13
Noninterest expense 10,409 10,600 5,496 5,961 888 1,158 16,793 17,719 (5)
Income before income taxes 1,438 1,923 6,307 9,083 544 665 8,289 11,671 (29)
Income tax expense (FTE basis) 521 706 2,246 3,272 201 246 2,968 4,224 (30)
Net income $ 917 $ 1,217 $ 4,061 $ 5,811 $343 $ 419 $ 5,321 $ 7,447 (29)
Net interest yield (FTE basis) 1.81% 2.02% 8.93% 9.04% 2.68%3.23% 3.88%4.45%
Return on average allocated equity 3.77 5.13 19.73 27.50 3.92 5.20 9.92 14.07
Return on average economic capital 14.35 21.10 40.20 55.30 5.16 7.03 23.01 33.52
Efficiency ratio (FTE basis) 86.34 83.49 36.03 32.90 51.81 56.09 57.86 53.89
Balance Sheet
Average
Total loans and leases n/m n/m $ 111,642 $126,083 $ 23,764 $ 26,889 $ 136,171 $153,641 (11)
Total earning assets (1) $ 433,908 $419,996 112,489 127,258 45,549 43,542 492,965 480,590 3
Total assets (1) 460,074 446,475 118,763 130,254 52,690 51,553 532,546 518,076 3
Total deposits 434,261 421,106 n/m n/m 42,837 40,679 477,440 462,087 3
Allocated equity 24,329 23,734 20,578 21,127 8,739 8,047 53,646 52,908 1
Economic capital 6,405 5,786 10,131 10,538 6,642 5,949 23,178 22,273 4
Year end
Total loans and leases n/m n/m $ 110,380 $120,668 $ 23,396 $ 25,006 $ 134,657 $146,378 (8)
Total earning assets (1) $ 455,999 $419,215 110,831 121,991 44,712 46,516 514,521 480,972 7
Total assets (1) 482,339 446,274 117,904 127,623 51,655 53,950 554,878 521,097 6
Total deposits 455,871 421,871 n/m n/m 42,382 41,519 498,669 464,264 7
(1) For presentation purposes, in segments and businesses where the total of liabilities and equity exceeds assets, we allocate assets to match liabilities. As a result, total earning assets and total
assets of the businesses may not equal total CBB.
n/m = not meaningful
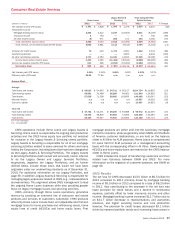
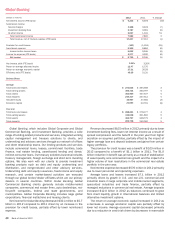
CBB, which is comprised of Deposits, Card Services and
Business Banking, offers a diversified range of credit, banking and
investment products and services to consumers and businesses.
Our customers and clients have access to a franchise network
that stretches coast to coast through 32 states and the District
of Columbia. The franchise network includes approximately 5,500
banking centers, 16,300 ATMs, nationwide call centers, and online
and mobile platforms.
The Federal Reserve adopted a final rule with respect to the
Durbin Amendment, which became effective October 1, 2011, that
established the maximum allowable interchange fees a bank can
receive for a debit card transaction. The interchange fee rules
resulted in a reduction of debit card revenue of approximately $1.7
billion in 2012 compared to a $430 million reduction in 2011. For
more information on the Durbin Amendment and the final
interchange rules, see Regulatory Matters on page 60.
CBB Results
Net income for CBB decreased $2.1 billion to $5.3 billion in 2012
compared to 2011 primarily due to lower revenue and higher
provision for credit losses, partially offset by lower noninterest
expense. Net interest income decreased $2.3 billion to $19.1
billion due to lower average loan balances primarily in Card
Services as well as compressed deposit spreads due to the
continued low rate environment. Noninterest income decreased
$1.6 billion to $9.9 billion primarily due to a decline in Card
Services. The provision for credit losses increased $451 million
to $3.9 billion with the increase largely in Card Services.
Noninterest expense decreased $926 million to $16.8 billion
primarily due to lower FDIC and operating expenses, partially offset
by an increase in litigation expense.
The return on average economic capital decreased primarily
due to lower net income. For more information regarding economic
capital, see Supplemental Financial Data on page 31.